Referenced from lesson Visualizing the “Shape” of Data
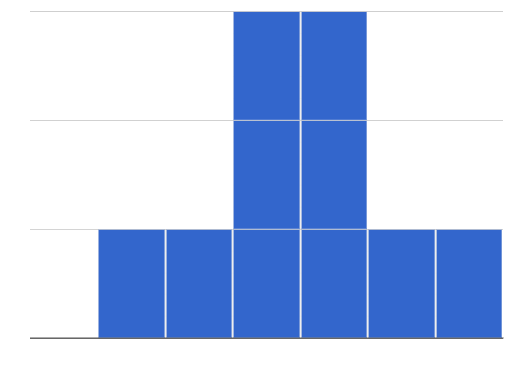
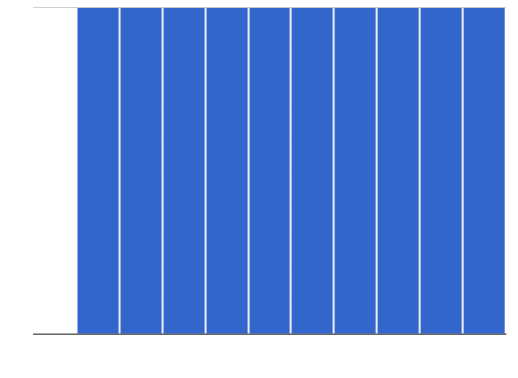
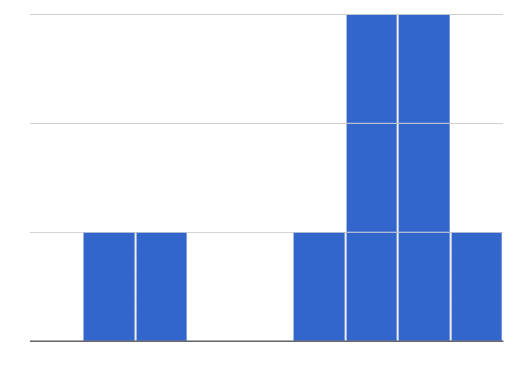
Students watched 5 videos, and rated them on a scale of 1 to 10. While the average score for every video is the same (5.5), the shapes of the ratings distributions were very different! Match the summary description (left) with the shape of the histogram of student ratings (right). For each histogram, the x-axis is the score, and the y-axis is the number of students who gave it that score. These axes are intentionally unlabeled - focusing on the shape is what matters here!
Most of the students were fine with the video, but a couple of them gave it an unusually low rating. |
1 |
A |
||
Most of the students were okay with the video, but a couple students gave it an unusually high rating. |
2 |
B |
||
Students tended to give the video an average rating, and they weren’t likely to stray far from the average. |
3 |
C |
||
Students either really liked or really disliked the video. |
4 |
D |
||
Reactions to the video were all over the place: high ratings and low ratings and inbetween ratings were all equally likely. |
5 |
E |


These materials were developed partly through support of the National Science Foundation,
(awards 1042210, 1535276, 1648684, and 1738598).  Bootstrap:Data Science by Emmanuel Schanzer, Nancy Pfenning, Emma Youndtsmith, Jennifer Poole, Shriram Krishnamurthi, Joe Politz, Ben Lerner, Flannery Denny, and Dorai Sitaram with help from Eric Allatta and Joy Straub
is licensed under a
Creative Commons 4.0 Unported License.
Based on a work at www.BootstrapWorld.org.
Permissions beyond the scope of this license may be available by contacting
schanzer@BootstrapWorld.org.
Bootstrap:Data Science by Emmanuel Schanzer, Nancy Pfenning, Emma Youndtsmith, Jennifer Poole, Shriram Krishnamurthi, Joe Politz, Ben Lerner, Flannery Denny, and Dorai Sitaram with help from Eric Allatta and Joy Straub
is licensed under a
Creative Commons 4.0 Unported License.
Based on a work at www.BootstrapWorld.org.
Permissions beyond the scope of this license may be available by contacting
schanzer@BootstrapWorld.org.