Referenced from lesson Spread of a Data Set (Spring, 2021)
The issue
People report being more and more stressed every day. This trend is extending beyond adults, and is being reported by children and teenagers. The amount of work people are responsible for has been increasing. To understand what makes us feel stressed, some important questions to ask are:
-
What factors affect my stress/chill level?
-
Do different personality types have different things that make them happy/sad?
-
Do you like to be alone or with people?
-
Is your stress/chill level a function of the environment in which you find yourself?
Objective
Students will analyze stress data and Personality Color data to answer these questions:
-
Do color personalities really predict a person’s personality?
-
Do people with different personality colors tend to have different stress levels?
-
What is the typical stress/chill level of the class across this project?
-
What is my typical stress/chill level and how does it compare to the whole class?
-
Do the stress/chill levels vary by weekday or weekend, or by the type of people you are with?
-
Under which conditions is my stress/chill level affected?
Procedure
First, take the Personality True Colors assessment, and calculate your personality type.
You will record your daily information using a survey you create, so that the entire class’s responses can be accessed from within a single spreadsheet. Use a random number generator to generate 2 random times a day for the next 5 days, including a weekend. If a time falls within the school day, it is up to the discretion of the teacher to allow you to record your entry at that time, or you will need to make a mental note and jot it down as soon as you can.
As is possible, take a photo of what you are doing at each time slot.
Survey questions
Create a Google Form with the following questions:
-
Date
-
Time
-
How stressed are you feeling right now? (3=very stressed. 0=not stressed at all.)
-
How many people are you with (not counting you)?
-
Who are you with?
-
Alone
-
Friends
-
Family
-
Friends & Family
-
Classmates
-
Teacher
-
Teacher & classmates
-
strangers
-
-
Where are you?
-
School
-
Work
-
Home
-
Public place
-
Others’ house
-
Commuting
-
-
Why are you here (in one word)?
-
What is your Personality Color?
 🖼Show image
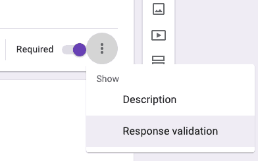
Be sure to to mark each question as "required", to ensure that there are no empty cells in the spreadsheet! If you know how to use response validation, add rules so that dates, times, numbers, etc. are all enforced. This will make your analysis a lot easier!
🖼Show image
Be sure to to mark each question as "required", to ensure that there are no empty cells in the spreadsheet! If you know how to use response validation, add rules so that dates, times, numbers, etc. are all enforced. This will make your analysis a lot easier!
Produce
Write a two-page report to address these research questions listed under the objective section. Your data analysis should include both numerical methods (means, medians, etc.) and graphical methods (plots). Use Pyret to produce these graphs (plots).
In your report, be sure to:
-
Provide the plot(s) and numerical summary (or summaries).
-
Describe what the plot shows.
-
Explain why you chose to make that particular plot.
-
Explain how the plot and numerical summary answers your statistical question.
-
Explain conclusions you made from your analysis.
-
Present your report to another student in the class to get feedback. Then make final edits before turning in the paper.
(Based on the What Stresses Us? project from IDS at UCLA)
These materials were developed partly through support of the National Science Foundation,
(awards 1042210, 1535276, 1648684, and 1738598).  Bootstrap:Data Science by the Bootstrap Community is licensed under a Creative Commons 4.0 Unported License. This license does not grant permission to run training or professional development. Offering training or professional development with materials substantially derived from Bootstrap must be approved in writing by a Bootstrap Director. Permissions beyond the scope of this license, such as to run training, may be available by contacting contact@BootstrapWorld.org.