By Hand
Suppose we have a dataset for a group of 50 adults, showing the number of teeth each person has…
0, 0, 0, 0, 0, 22, 26, 27, 28, 28, 28, 28, 29, 29, 29, 30, 30, 30, 30, 30, 31, 31, 31, 32, 32, 32, 32, 32, 32, 32, 32, 32, 32, 32, 32, 32, 32, 32, 32, 32, 32, 32, 32, 32, 32, 32, 32, 32, 32, 32
1 Use the data to complete the frequency table below. (The last cell has been completed for you.)
| number of teeth | 0-4 | 5-9 | 10-14 | 15-19 | 20-24 | 25-29 | 30-34 |
|---|---|---|---|---|---|---|---|
frequency |
35 |
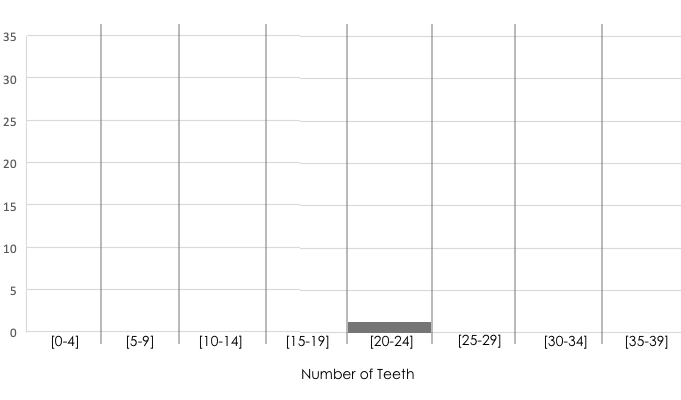
2 Use the frequency table to draw a histogram below, filling in each interval so that its height is equal to the frequency.

In CODAP
Open the Tooth Data Starter File. Make a copy.
3 Look at the table that appears in the starter file. What do you see?
4 What bin sized was used for the histogram above?
5 Review the tooth table. How does this data compare to the tooth data that appeared in the first section?
6
Drag Num Teeth to the x-axis and select Group into Bins from the Configuration menu. Fuse dots into bars, then enter the desired bin width of 5.
7 How does the histogram you created in CODAP look similar to the one that you drew? Are there any ways in which the histogram you created in CODAP is different than the one you created by hand?
These materials were developed partly through support of the National Science Foundation, (awards 1042210, 1535276, 1648684, 1738598, 2031479, and 1501927).  Bootstrap by the Bootstrap Community is licensed under a Creative Commons 4.0 Unported License. This license does not grant permission to run training or professional development. Offering training or professional development with materials substantially derived from Bootstrap must be approved in writing by a Bootstrap Director. Permissions beyond the scope of this license, such as to run training, may be available by contacting contact@BootstrapWorld.org.