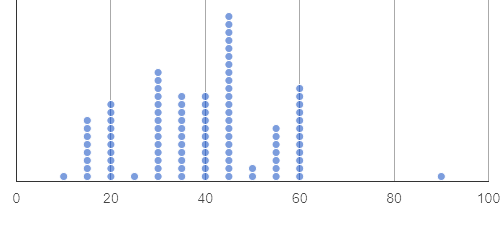
A dot plot (below) is a data visualization consisting of data points plotted along a number line.

On the dot plot (above), each data point represents one student in a sample.
The position of the data point indicates how many minutes it takes for that student to get ready for school. We see, for example, that there is only one students who gets ready in 10 minutes and there are 8 students who take 15 minutes to get ready.
Distribution of Data. To describe the distribution of data—the way that it is spread out on a number line—it is helpful to locate any outliers, clusters, peaks, and gaps.
-
A cluster is a group of data points that are close together. Most of the data in the dot plot above is clustered from 10-60, meaning that most students spend between 10 minutes and an hour getting ready for school in the morning.
-
A gap is an interval where there are no data points. On the dot plot above, there is a gap from 60 to 90. In this sample, no one takes between 60 and 90 minutes to get ready.
-
An outlier occurs when one data point is much larger or smaller than the other data points. There is an outlier on the above dot plot at 90. One student requires much more time to get ready in the morning.
-
A peak is the value(s) with the most data. In this sample, 45 minutes is the most common amount of time spent getting ready for school.
Typicality of Data
-
Typicality in a dataset is what we expect from a dataset. We can estimate typicality by looking for peaks and clusters in a dataset.
-
In looking at the dot plot above, we might estimate that students typically spend 40 or 45 minutes getting ready for school.
Variability of Data
-
Variability is how different or alike the data points are. In a quantitative dataset we can measure and describe the variability using range, interquartile range, and standard deviation.
-
Statistical questions are questions that anticipate variability.
-
"In general, how tall are the students in your class?" does anticipate variability.
-
"How many inches are in a foot?" does not anticipate variability. The answer is always 12.
These materials were developed partly through support of the National Science Foundation, (awards 1042210, 1535276, 1648684, 1738598, 2031479, and 1501927).  Bootstrap by the Bootstrap Community is licensed under a Creative Commons 4.0 Unported License. This license does not grant permission to run training or professional development. Offering training or professional development with materials substantially derived from Bootstrap must be approved in writing by a Bootstrap Director. Permissions beyond the scope of this license, such as to run training, may be available by contacting contact@BootstrapWorld.org.