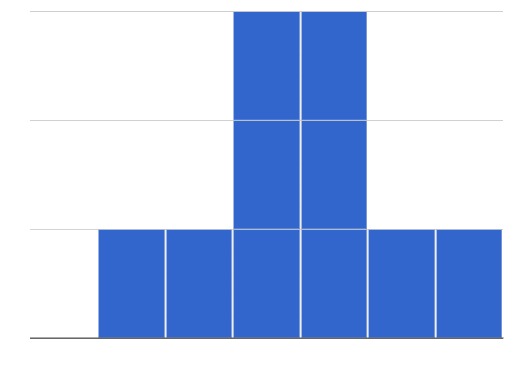
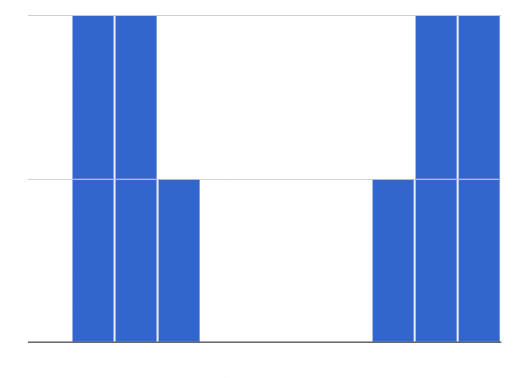
1 Students watched 2 videos, and rated them on a scale of 1 to 10. The average score for every video is the same (5.5).
Movie A |
|
Comparing the two graphs, we know that:
|
Movie B |
|
Explain how you arrived at your answer:
|
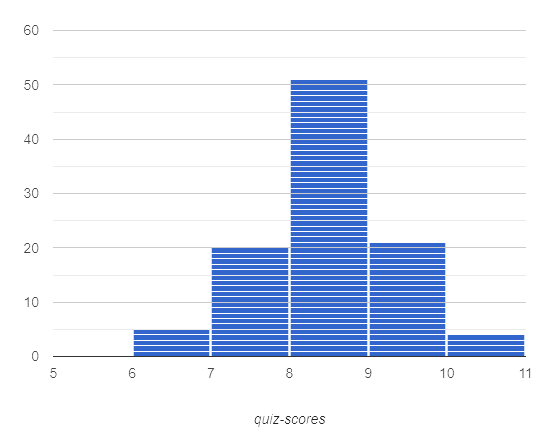
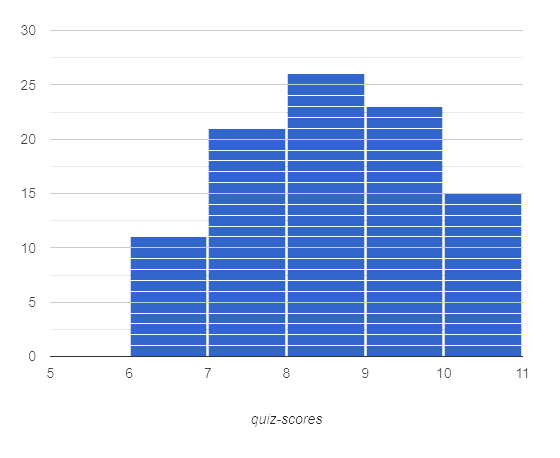
2 The following graphs show the distribution of quiz scores for two classes.
Class 1 |
|
Comparing the two graphs, we know that:
|
Class 2 |
|
Explain how you arrived at your answer:
|
3 Caro says, "Flatter histograms always show less variability." Is she correct? Explain why you agree or disagree with Caro.
These materials were developed partly through support of the National Science Foundation, (awards 1042210, 1535276, 1648684, 1738598, 2031479, and 1501927).  Bootstrap by the Bootstrap Community is licensed under a Creative Commons 4.0 Unported License. This license does not grant permission to run training or professional development. Offering training or professional development with materials substantially derived from Bootstrap must be approved in writing by a Bootstrap Director. Permissions beyond the scope of this license, such as to run training, may be available by contacting contact@BootstrapWorld.org.


