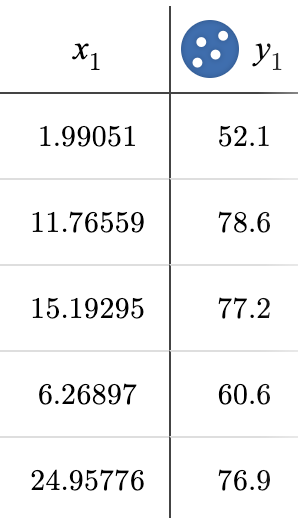
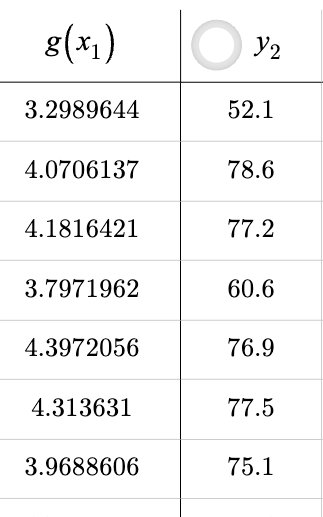
For this page, you’ll need Slide 8: Wealth-v-Health (Transformed) of Fitting Wealth-v-Health and Exploring Logarithmic Models (Desmos).
1 Compare the two tables below from the Desmos file we are about to work with.
| Wealth vs. Health | Log(Wealth) vs. Health | What do you Notice or Wonder? |
|---|---|---|
|
|
|
Fitting a Model
This slide contains two tables, a list and a function:
|
|
2 Notice how the red dots (representing the data points from the original table) are dispersed on the graph.
-
Hide these data points from the graph by clicking on the "points" circle () at the top of the y₁ column.
-
Then click on the triangle () in front of the folder name to hide the table.
-
Turn ON the points for the
Log(Wealth) vs. Healthtable by clicking on the "points" circle () at the top of the y₂ column
How does the new graph look different from the original graph?
3 Scroll to the bottom of the Log(Wealth) vs. Health table and click the to rescale the graph.
4 Looking at the point cloud, the best model for this dataset would be (circle one): linear quadratic exponential
5 Why do you think transforming the x-values makes our data look linear?
6 Move the sliders for m and b at the bottom left to find the best-fitting linear model you can:
f(x) = slope (m)x + y-intercept / vertical shift |
| Let’s compare the model settings from your linear and logarithmic models. | ||
|---|---|---|
Linear (From above) |
slope (m) |
y-intercept / vertical shift |
Logarithmic (From Fitting Logarithmic Models) |
log coefficient (a) |
vertical shift (k) |
7 How are they similar?
These materials were developed partly through support of the National Science Foundation, (awards 1042210, 1535276, 1648684, 1738598, 2031479, and 1501927).  Bootstrap by the Bootstrap Community is licensed under a Creative Commons 4.0 Unported License. This license does not grant permission to run training or professional development. Offering training or professional development with materials substantially derived from Bootstrap must be approved in writing by a Bootstrap Director. Permissions beyond the scope of this license, such as to run training, may be available by contacting contact@BootstrapWorld.org.

