Deconstructing a Model
1 The four functions below are defined in the Hybrid CO2 Models Starter File. Use fit-model to fit periodic-cos and periodic-cos2 to the recent-table data.
fun periodic-cos(x): (4.13 * cos(6.28 * (x - 2023.35))) + 419.87 end
fun wave-cos(x):     (4.13 * cos(6.28 * (x - 2023.35)))          end
fun midline-cos(x):                                       419.87 end
fun periodic-cos2(x):     wave-cos(x)      +      midline-cos(x) end
2 Read these 4 functions carefully, and explain why periodic-cos2 will produce the same graph as periodic-cos.
Review: Other Models We’ve Seen
Linear |
Quadratic |
Exponential |
Logarithmic |
|
Sketch |
||||
Key Characteristics |
What kind of model?
|
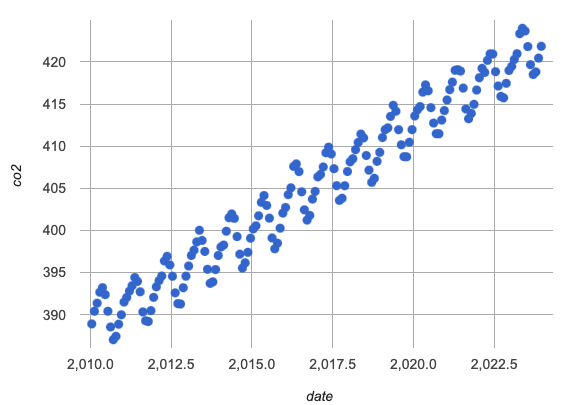
3 What do you Notice about this scatter plot? What do you Wonder?
4 Which of the other models you described above would make the most sense to fit to this scatter plot? Why?
|
These materials were developed partly through support of the National Science Foundation, (awards 1042210, 1535276, 1648684, 1738598, 2031479, and 1501927).  Bootstrap by the Bootstrap Community is licensed under a Creative Commons 4.0 Unported License. This license does not grant permission to run training or professional development. Offering training or professional development with materials substantially derived from Bootstrap must be approved in writing by a Bootstrap Director. Permissions beyond the scope of this license, such as to run training, may be available by contacting contact@BootstrapWorld.org.
