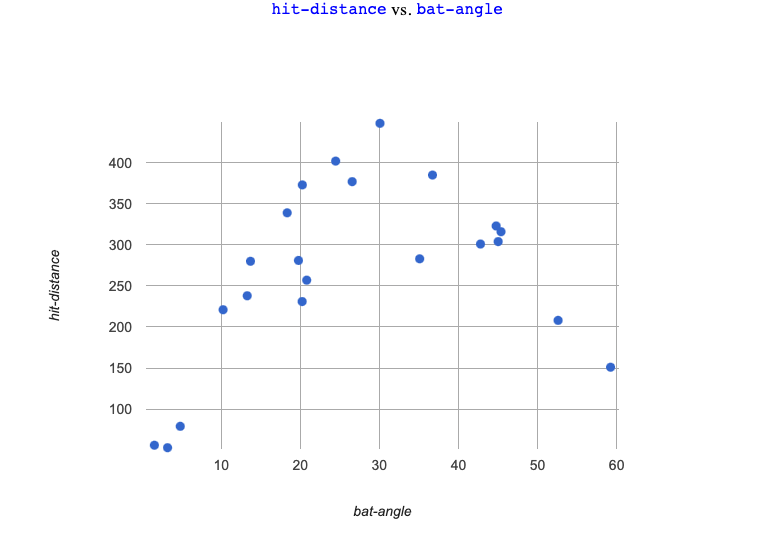
For this page, you’ll need to open the Aaron Judge Starter File on your computer. If you haven’t already, select Save a Copy from the "File" menu to make a copy of the file that’s just for you.
Note: For this page we will be focusing on just the curve balls, so make sure you are writing code using curve-table
Fitting Linear Models
1 Use lr-plot(curve-table, "id", "bat-angle", "hit-distance") to find the optimal linear model.
What is S for this model?
Write the model below, in both math and Pyret notation.
y = slopex + y-intercept / vertical shift fun y(x): ( * x) + end
2 Sketch the linear model from your
|
3 What do you Notice? 4 What do you Wonder?
5 Is the best-possible linear model a good fit? Why or why not?
|
Fitting Curves
6 Draw a curve on the scatter-plot, which shows the overall shape in the data.
|
7 How would you describe the pattern?
8 At what
9 Based on your best-guess curve, predict the
|
These materials were developed partly through support of the National Science Foundation, (awards 1042210, 1535276, 1648684, 1738598, 2031479, and 1501927).  Bootstrap by the Bootstrap Community is licensed under a Creative Commons 4.0 Unported License. This license does not grant permission to run training or professional development. Offering training or professional development with materials substantially derived from Bootstrap must be approved in writing by a Bootstrap Director. Permissions beyond the scope of this license, such as to run training, may be available by contacting contact@BootstrapWorld.org.
