![]()
Overview
Learning Objectives
Capture essence of an animation in a data structure
Create images for single frames of an animation
Write a function to generate data structure instances for a frame from the instance for the previous frame
Use reactors to define animations
Understand how animations are built from simple functions
Evidence Statementes
Product Outcomes
Students create a complete animation of a sunset
Students learn to use data structures to model the state of an animation
Materials
Pens/pencils for the students, fresh whiteboard markers for teachers
Class poster (List of rules, design recipe, course calendar)
Editing environment (Pyret Editor)
Language Table
Preparation
Computer for each student (or pair), running the Pyret Editor
The sunset starter file loaded on student machines
You’ve learned how to create data structures, and how to create images. Now it’s time to put these together to create an animation in Pyret. We’ll even go a step further than what we did in Bootstrap:Algebra, creating an animation with movement in two dimensions.
In Bootstrap:Algebra, many decisions about your animation were made for you. We told you how many characters you had and which aspects of them could change during the animation. The danger always moved in the x-axis, the player always moved in the y-axis. In Bootstrap:Reactive, we give you much more control of your game: you decide how many characters you will have, and what aspects of them can change (position, color, size, etc). In order to have this flexibility, we need to do a little more work to set up the animation. Let’s break down an animation to see what we need.
Let’s create an animation of a sunset. The sun will start at the top-left corner of the screen and fall diagonally down and right across the sky. Here’s a running version of the animation we are trying to create. Notice that the sun dips below the horizon in the bottom-right corner.
In Bootstrap:Algebra, we talked about how an animation is made of a sequence of images that we flip through quickly. We continue to think of an animation as a sequence of images in Bootstrap:Reactive. For example, here are the first three frames of the sunset animation:

Where will we get this sequence of images? We don’t want to create them all by hand. Instead, we want to write programs that will create them for us. This is the power of computer programming. It can automate tasks (like creating new images) that might otherwise be tedious for people to do. There are four steps to creating animations programs. You’ve actually already done the first three in the first two units, but now we need to show you how to put them together.
This is a key point at which to emphasize why functions are important to computer science. Computers are good at repetition, but they need instructions telling them what steps to repeat. Functions capture those instructions.
- The first step is to develop a data structure for the information that changes across frames. To do this, we need to figure out what fields our data structure will need.
Turn to Page 16 in your workbook. Copy the three sunset images we gave you into the boxes at the top of the worksheet.
To identify the fields, we have to figure out what information is needed to create each frame image. Information that changes from frame to frame must be in the data structure.On your worksheet, fill in the table just below the three images to indicate what information changes across the frames.
Hopefully, you identified two pieces of changing information: the x-coordinate of the sun and the y-coordinate of the sun. Each image also contains the horizon (the brown rectangle), but that is the same in every frame. Let’s write down a data structure that captures the two coordinates.
Fill in the second table, giving a name and type for each of the x-coordinate and y-coordinate. Then fill in the SunsetState data structure definition that we started for you at the bottom of the page. Use sunset as the name of the constructor.
You should have come up with something like this: a data block with numbers for the two coordinates. The term state is used in computer science to refer to the details of a program at a specific point in time. Here, we use it to refer to the details that are unique to a single frame of the animation.
We have the students copy the images into the workbook partly to make sure they understand what images they are working with and partly so that they have a self-contained worksheet page for later reference.
We are adopting a convention here, in which we include "State" in the name of the data block, then use the same base name (without "State") for the constructor. By not conflating the names here, students should have an easier time distinguishing between the constructor name and data structure name.
- Any time we make a data structure, we should make some sample instances: this helps check that we have the right fields and gives us data to use in making examples later.
At the bottom of the worksheet, use the sunset constructor to write write down the SunsetState instance for the first frame (labeled "Sketch A"). It has x-coordinate 10 and y-coordinate 300.
- The second step in making an animation is to write a function that consumes an instance of one state and produces the image for that instance. We call this function draw-state. For sunset, draw-state takes a SunsetState instance and produces an image with the sun at that location (dipping behind the horizon when low in the sky). This function should use put-image, as we did with the hikers in unit 1.
Go to Page 18 in your workbook and develop the draw-state function described there. Type in your function and use it (in the interactions window) to draw several individual sunset frames.
You may have noticed that we used SunsetState instead of sunset as the domain name. Remember that sunset is just the name of the constructor, while SunsetState is the name of the type. We use SunsetState whenever we need a type name for the domain or range.
We can now draw one frame, but an animation needs many frames. How can we draw multiple frames? Let’s simply the problem a bit: if you have the instance for one frame, how do we compute the instance for the next frame? Note we didn’t ask how to produce the image for the next frame. We only asked how to produce the next SunsetState instance. Why? We just wrote draw-state, which produces the image from a SunsetState. So if we can produce the instance for the next frame, we can use draw-state to produce the image.
Separating the instance from the image of it is key here: when we produce an animation, we actually produce a sequence of instances, and use draw-state to produce each one. Students may need some practice to think of the instance as separate from the image that goes into the animation.
- The third step in making an animation is to write a function that consumes an instance of one state and produces the instance for the next state. We call this function next-state-tick. For sunset, next-state-tick takes a SunsetState instance and produces a SunsetState instance that is just a little lower in the sky.
Go to Page 19 in your workbook and develop the next-state-tick function described there. Use the sample SunsetState instances that you developed in step 1 as you make your examples of the function. Then, type in the code you have so far (including the data definition for SunsetState into the sunset starter file, and make sure your examples are producing the expected answers.
- Together, the draw-state and next-state-tick functions are the building blocks for an animation. To start to see how, let’s first use these two functions to create the first several frames of an animation by hand (then we’ll show you how to make more frames automatically).
Run each of the following expressions in the interactions window in turn. Just copy and paste them, rather than type them by hand each time:
draw-state(sunset(10,300))
next-state-tick(sunset(10,300))
Now use draw-state on the result of next-state-tick, then call next-state-tick again:
draw-state(sunset(18,296))
next-state-tick(sunset(18,296))
draw-state(sunset(26,292))
next-state-tick(sunset(26,292))
Do you see the sun getting lower in the sky from image to image? Do you see how we are creating a "chain" of images by alternating calls to draw-state and next-state-tick? We use next-state-tick to create the instance for a new frame, then use draw-state to produce the image for that frame.(Optional) Here’s another way to see the same sequence of expressions. Run each of the following expressions in the interactions window in turn. Just copy and paste them, rather than type them by hand each time:
draw-state(sunset(10,300))
draw-state(next-state-tick(sunset(10,300)))
draw-state(next-state-tick(next-state-tick(sunset(10,300))))
draw-state(next-state-tick(next-state-tick(next-state-tick(sunset(10,300)))))
Do you see what this sequence of expressions does? Each one starts with the sun in the upper-left corner, calls next-state-tick one or more times to compute a new position for the sun, then draws the state. Notice that this sequence only has us write down one SunsetState instance explicitly (the first one). All the others are computed from next-state-tick. If we could only get Pyret to keep making these calls for us, and to show us the images quickly one after the next, we’d have an animation!These sequences show students how the two functions work together to create an animation. If you feel the second one that composes next-state-tick with itself many times is too complicated for your students, you can skip it. The goal of the second sequence is to show that we only need an initial instance and the two functions to generate a sequence of images that make up an animation.
- The fourth (and final) step in making an animation is to tell Pyret to create an animation using an initial SunsetState instance and our draw-state and next-state-tick functions. To do this, we need a new construct called a reactor. A reactor gathers up the information needed to create an animation:
An instance of the data at the start of the animation
(Optional) A function that knows how this data should change automatically as time passes
(Optional) A function that knows how to take this data and draw one frame of the animation
Proceed slowly here – this is a very abstract concept, so you’ll want to do a lot of checking for understanding.
A reactor is designed to "react" to different events. When the computer’s clock ticks, we’d like to call next-state-tick on the reactor’s state, and have it update to the next state automatically. Reactors have event handlers, which connect events to functions.
Here, we define a reactor named sunset-react for the sunset animation: init tells the reactor which instance to use when the program starts. In this example, the program will start with a SunsetState instance with the sun at (10, 30). on-tick and to-draw are event handlers, which connect tick and draw events to our next-state-tick and draw-state functions.Copy this reactor definition into your sunset animation program.
The reactor is new to Bootstrap:Reactive. In Bootstrap:Algebra, every student had the same reactor "under the hood", and had to fill in the handlers. This made it easy to focus on the basics and write those handlers, but it also meant that everyone’s game looked a lot alike! In Bootstrap:Reactive, however, students get to customize the states of their reactors, and gives them a lot of flexibility in how to deal with events!
- If you run your sunset program after adding the reactor, nothing seems to happen. We have set up an animation by defining sunset-react, but we haven’t told Pyret to run it. You could define multiple reactors in the same file, so we have to tell Pyret explicitly when we want to run one.
Type interact(sunset-react) in the interactions window to run your sunset animation.
The Bootstrap:Algebra teachpacks started the animation automatically. In Bootstrap:Reactive, you have to start the animation manually by calling interact.
What happens when we call interact? The following diagram summaries what Pyret does to run the animation. It draws the initial instance, then repeatedly calls next-state-tick and draw-state to create and display successive frames of your animation.
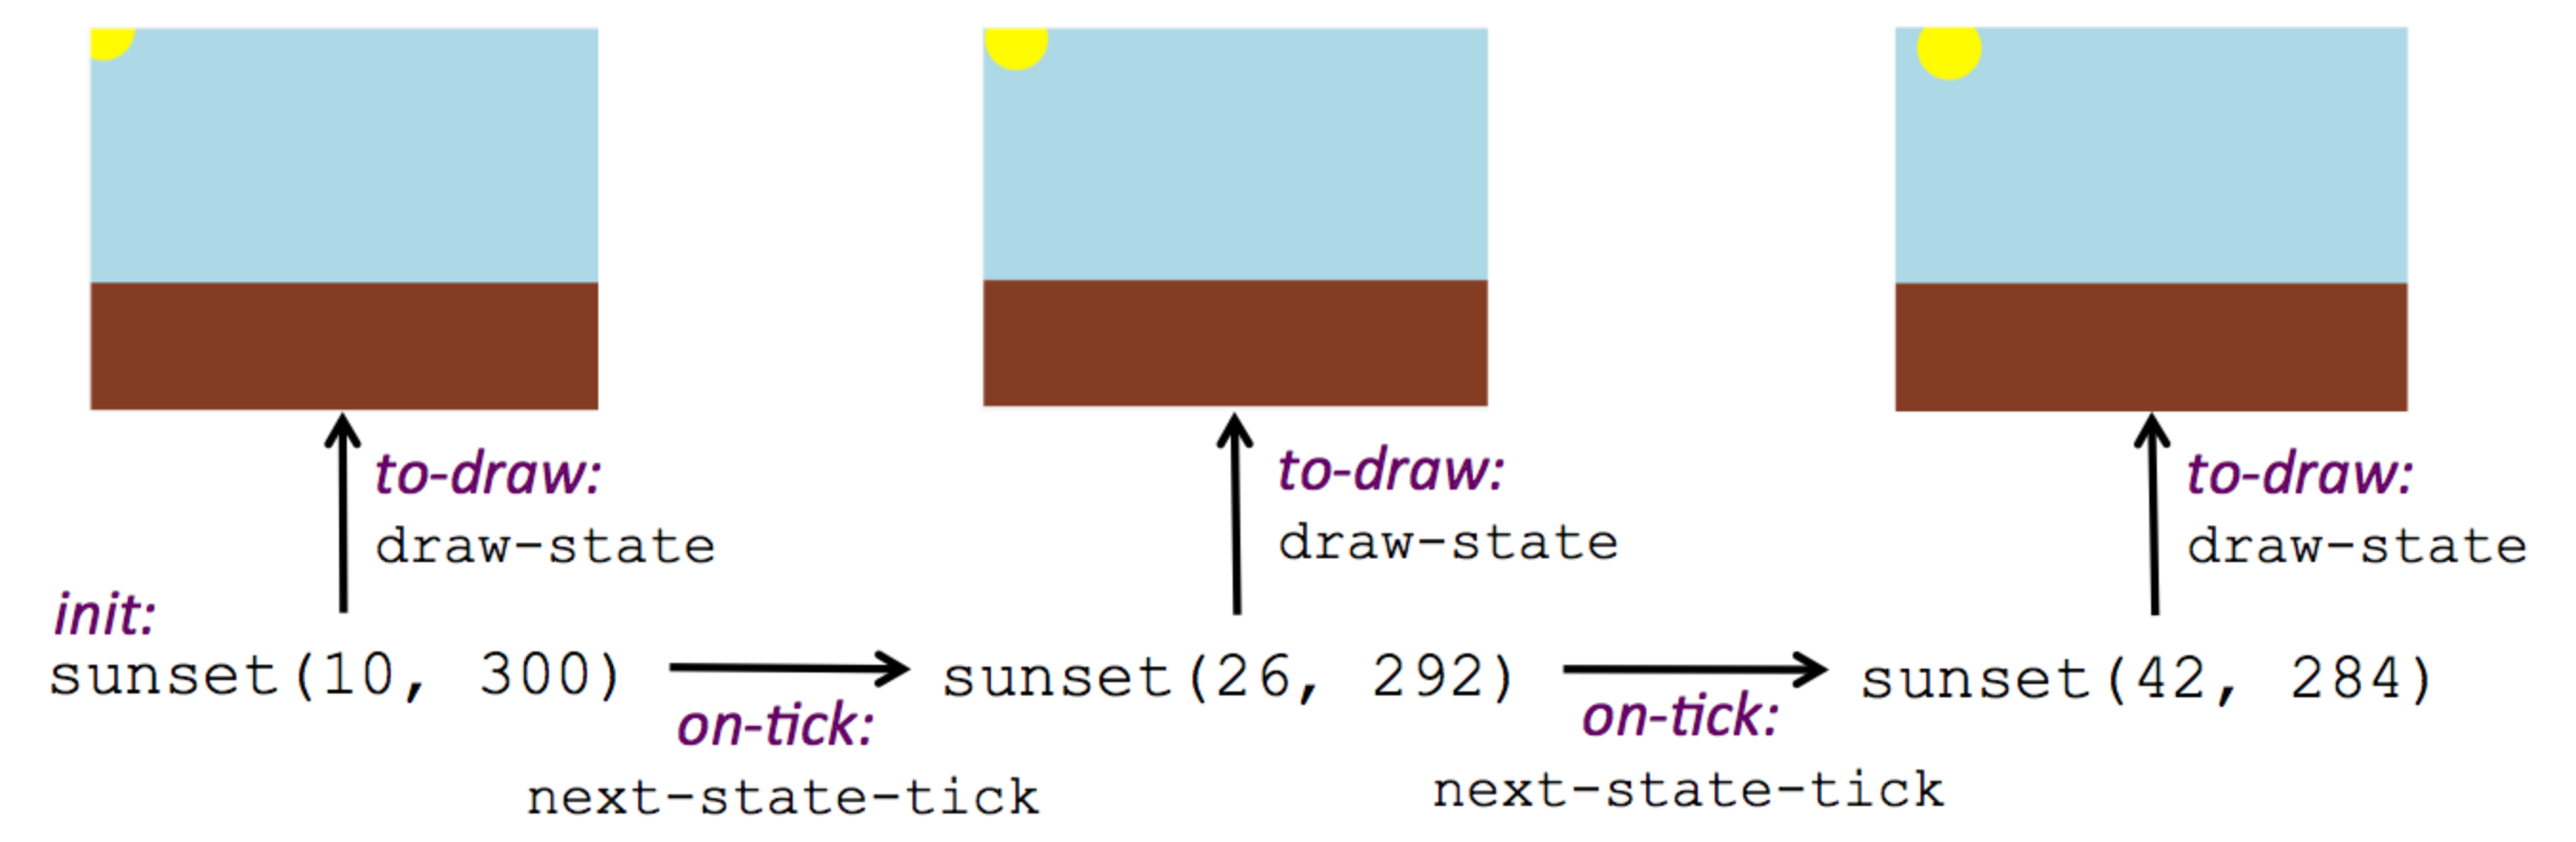
These are the same computations you did by hand in the interactions window a little while ago, but Pyret now automates the cycle of generating and drawing instances. By having functions that can generate instances and draw images, we can let the computer do the work of creating the full animation.
This figure may be too complex for some students. Hopefully it helps you, and perhaps them, see how an animation arises from the two functions we’ve written in this lesson.
Functions are essential to creating animations, because each frame comes from a different SusetState instance. The process of drawing each instance is the same, but the instance is different each time. Functions are computations that we want to perform many times. In an animation, we perform the draw-stateand next-state-tick functions once per frame. Animations are an excellent illustration of why functions matter in programming.
Whether you are primarily teaching math or CS, helping students see the idea of functions and repeated computations is a key part of what Bootstrap tries to teach. Animations are a powerful illustration of repeated computations that functions can capture naturally.
Summarizing what we have seen so far, we have to write four things in order to make an animation:
Create a data structure to hold the information that changes across frames. This information is called the state.
Write a function to generate an image of the current state (we’ll call this draw-state).
Write a function to generate a new state from a given state (we’ll call this next-state-tick).
Define a reactor that will use an initial instance of the state and the two functions to create an animation.
At this point, you could create your own animation from scratch by following these four steps. If you do, you may find it helpful to use the animation design worksheet on page Page 41 in your workbook: it takes you through sketching out your frames, developing the data structure for your animation state, and writing the functions for the animation. It also gives you a checklist of the four steps above. The checklist mentions a fifth (optional) step, which involves getting your characters to respond when the user presses a key. You’ll learn how to do that in the next unit.
The animation-design worksheet is a condensed summary of the steps to creating an animation. If your students still need more scaffolding, follow the sequence of sheets that we used to develop sunset, including explicit worksheets for draw-state and next-state-tick. If your students are doing fine without the scaffolding of the design recipe worksheets, the condensed worksheet should suffice to keep them on track (though they should still write tests and follow the other steps of the design recipe as they work).
You have just seen the incredible power of functions in programming! Functions let us generate content automatically. In the early days of making cartoons, artists drew every frame by hand. They had to decide at the beginning how many frames to create. Here, we let the computer generate as many frames as we want, by letting it call next-state-tick over and over until we stop the animation. If we want to slow down the sunset, we simply change the new coordinates within next-state-tick. If we start with a larger screen size, the computer will continue to generate as many images as we need to let the sun drop out of the window. The computer can give us this flexibility as long as we provide a function that tells the computer how to generate another frame.