The field of K-12 Data Science Education is new, and there's little published information about learning outcomes, students' experiences and perceptions, etc. We've been developing instruments to measure various outcomes over the past few years, and are excited to share the very earliest findings thus far. Our work in the Data Science field has been operating at national scale since 2017 - which makes us one of the “veteran” providers in the field.
This blog post outlines the preliminary findings from one of the first surveys of student experiences with K12 Data Science. More than 400 students were asked to complete a survey at the end of the 2020-2021 school year, reflecting on their own learning, as well as their sense of ownership and authenticity in the data analysis they performed in their classes. All students attended public schools, and learned Data Science in a variety of classes ranging from Math, AP CS Principles, Science, History, and Statistics classes.

While letting students choose their own dataset isn't a required part of Bootstrap:Data Science, the curriculum and materials are written with the assumption that students will indeed be selecting a dataset of their own. Something we've learned over the years is that the “fitness” of a dataset for a student is incredibly important - and there are several factors that determine fitness!
All but one of the students in the sample chose their own dataset, which may explain why so many found the analysis interesting. But their reasons for doing so are far more exciting! Students were given multiple reasons why they might have chosen their dataset, and were asked to select all that apply.
Three students indicated that they “did not have a choice”, but two of those respondents also selected reasons for making their choice. Only one student left “no choice” as their only answer, and this student wound up analyzing the “learning dataset” that every student uses when they start the class.
42.1% of the students in the sample chose their dataset because “it's something I already know about”, and 41.1% of students chose it because “I don't know much about it, and I was curious”. Given that students tend to accumulate knowledge about things they are curious about, it's likely that the prior-knowledge group is also a measure of curiosity. In other words, a solid majority of students in the sample chose their dataset because of a prior interest or curiosity. This is a resounding call for Data Science teachers to meet students where they are, providing datasets that cater to their interests and curiosities. Curricula that are built around “canned” datasets may need to work harder to spark engagement.
The third most common reason was “It affects me personally”, which most often showed up in conjunction with one or more of the top-2 reasons. This overlap between “personally affects me” and curiosity should come as no surprise to the reader. Only four students listed this as their only reason for choosing a dataset.
Taken together, these three reasons accounted for 72.63% of all student selections. The next most frequent response was “no reason”. While 11 students selected it, three of them selected it in addition to other reasons. That leaves 8 (8.42%) students who chose their dataset for no reason. Note that this is the fourth most-frequently cited rationale, with the other rationales being cited only once, and usually in conjunction with the more common responses.

A student who knows nothing about music would find the creation of a histogram showing the distribution of beats-per-minute to be a purely academic, contrived exercise. But for a student who knows a great deal about music, making that histogram might be genuinely enlightening. This underscores the pivotal role of the dataset itself in students' perception of authenticity, engagement, and relevance. By applying their own prior knowledge and intuition, students make sense of the analysis they do in Bootstrap:Data Science, and that sense-making may be pushing the “authenticity score” higher than we would otherwise expect.
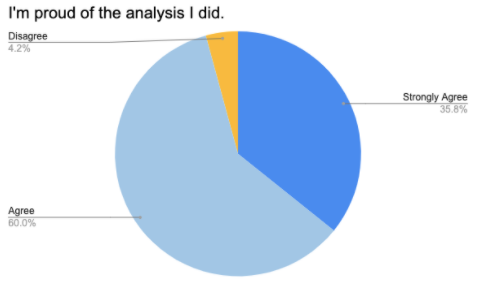
We asked three questions of the form “I learned X”, focused on Programming, Data Analysis, and Graphing. 96.8% of students agreed or strongly agreed that they learned some programming. This is unsurprising, given that this may have been the first programming course for many of the students. And for those who've programmed before, this was almost certainly their first Data Science course! In fact, it's almost certain that 100% of students learned some programming, but with surveys like this there is always some variability.
That's what makes the next number so surprising: 100% of students reported that they learned some data analysis. “100%” is simply not a number we see often in this kind of inquiry, and it stands out simply for being so unusual.
Despite the fact that every single data display used in Bootstrap:Data Science is covered by middle-school math standards, 93.5% of students reported that they “learned some new graphing and visualization”. This suggests that the overwhelming majority of students either deepened their understanding of these displays, or perhaps filled in gaps in what they remembered from middle school. Either way, this is an encouraging early result as we consider the math transfer element of the curriculum, and we hope that math teachers will take note!
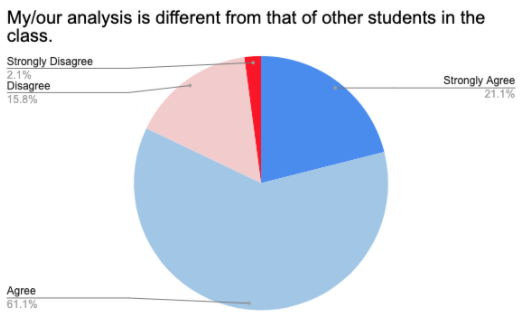
These numbers, taken together, paint a fascinating picture. Two thirds of students got ideas from their classmates, which suggests a substantive amount of sharing and listening was happening in these classrooms. But when combined with the “uniqueness” measure, this gives us insight into the nature of those conversations. If students had simply copy-pasted code from other groups or blindly repeated the analysis of a peer, we would expect a drop in their perception of their work as truly unique. But with the overwhelming majority of students reporting that their analysis was different from others and the majority giving credit to peers for sharing ideas, this suggests a deeper level of conversation than simply copy-pasting!

Perhaps the most significant question raised by the data is how important the choice-of-dataset is in student engagement, ownership, and perceived authenticity. The overwhelming majority of students chose their datasets due to prior interest - would engagement, ownership, and authenticity have dropped if they were forced to use a dataset for which they had no interest? All three of these likely have second-order effects on the “hard” learning outcomes: after all, if a student is disengaged and is only going through the motions of an academic exercise, they are far less likely to learn and internalize the statistics and computing concepts at work! We've learned volumes about the difference between a “usable dataset” and a “good dataset” for K-12 contexts, and we believe our experience over the past five years has led to the creation of one of the best dataset libraries out there—and plays a major role in the results seen here. We plan to share the lessons we've learned about “good datasets” in a separate post.
This data also suggests that peer-discussion is an important factor for this population of students. Two-thirds of them reported that they got ideas from their peers, suggesting that communication played a role in their analysis. Students would not have given their peers credit if they didn't feel like they had genuinely benefited from their input, and they would not have described their work as unique if those benefits had been a simple matter of copy-and-paste.
With creativity, ownership, and authenticity being significant goals for the K-12 computing field at large, we're encouraged to see that the results from our first student survey on Data Science are in-line with the results we published for our Algebra materials. We're also excited to roll out our assessment instruments for learning outcomes in the coming school year, which will measure the degree to which students are learning core Data Science skills.
Posted September 30th, 2021