Order of Operations
Domain and Range
Function Composition
Defining Values
Making Flags
Defining Functions
Solving Word Problems
Restating the Problem
Character Animation
Problem Decomposition
Introduction to Computational Data Science
Starting to Program
Defining Functions
Applying Functions
Displaying Categorical Data
Data Displays and Lookups
Table Methods
Defining Table Functions
Method Chaining
Order of Operations
Order of Operations
Students learn to model arithmetic expressions with a visual tool for order of operations, known as "Circles of Evaluation".
Prerequisites |
|
Relevant Standards |
Select one or more standards from the menu on the left (⌘-click on Mac, Ctrl-click elsewhere). Oklahoma Standards
|
Lesson Goals |
Students will be able to:
|
Student-facing Goals |
|
Materials |
|
Preparation |
|
Supplemental Resources |
|
Key Points For The Facilitator |
|
Click here to see the prior unit-based version.
- circle of evaluation
-
a diagram of the structure of an expression (arithmetic or code)
- definitions area
-
the left-most text box in the Editor where definitions for values and functions are written
- editor
-
software in which you can write and evaluate code
- error message
-
information from the computer about errors in code
- expression
-
a computation written in the rules of some language (such as arithmetic, code, or a Circle of Evaluation)
- function
-
a mathematical object that consumes inputs and produces an output
- interactions area
-
the right-most text box in the Editor, where expressions are entered to evaluate
- value
-
a specific piece of data, like 5 or "hello"
Numbers 10 minutes
Overview
Students experiment with the Editor, exploring the different kinds of numbers and how they behave in this programming language.
Launch
Students should open code.pyret.org (CPO) in their browser, and click "Sign In". This will ask them to log in with a valid Google account (Gmail, Google Classroom, YouTube, etc.), and then show them the "Programs" page. This page is empty - they don’t have any programs yet! Have them click "Open Editor".
Our Editing Environment
 🖼Show image
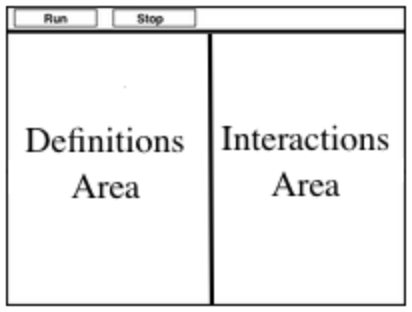
This screen is called the Editor, and it looks something like the diagram you see here. There are a few buttons at the top, but most of the screen is taken up by two large boxes: the Definitions Area on the left and the Interactions Area on the right.
🖼Show image
This screen is called the Editor, and it looks something like the diagram you see here. There are a few buttons at the top, but most of the screen is taken up by two large boxes: the Definitions Area on the left and the Interactions Area on the right.
The Definitions Area is where programmers define values and functions that they want to keep, while the Interactions Area allows them to experiment with those values and functions. This is like writing function definitions on a blackboard, and having students use those functions to compute answers on scrap paper.
For now, we will only be writing programs in the Interactions Area on the right.
Investigate
Math is a language, just like English, Spanish, or any other language. We use nouns, like "bread", "tomato", "mustard" and "cheese" to describe physical objects. Math has values, like the numbers 1, 2 or 3, to describe quantities.
Try typing the number 42 on the right, and then hitting "Enter" or "Return". What did this number evaluate to? (Hint: Numbers should evaluate to themselves - if you didn’t get back the same number you put in, something is very wrong!)
If working in pairs, make sure you each take a turn at the keyboard. Suggestions:
-
How large of a number can you enter?
-
How small of a number can you enter?
-
What happens if you type two numbers on the same line?
-
Do fractions work? Decimals?
-
Do negative numbers work?
Remember, we’re only trying numbers for now, not operations like 3 - 6, √16 or 4^2
Notice & Wonder In pairs, students will each try entering a variety of numbers in the Interactions Area, hitting "Enter" each time to see what the computer does. Then they will write down what they Notice and Wonder on Notice and Wonder (Page 2). |
-
What did you Notice? What do you Wonder?
-
Did you get any error messages? If so, read it carefully - what do you think it means?
Student Misconceptions
-
Students who write decimals as
.5(without the leading zero) may get an error message, causing them to think that Pyret doesn’t have decimals! They just need to add the zero. -
Students who try division by writing
3/2and get an answer may falsely assume that they’ve performed division. In fact, what they’ve done is entered a rational number. ("Two-thirds" is equivalent to the expression "two divided by three", but only insofar as they result in the same value. "2" is equivelent to expression "10 minus 8", for the same reason!) -
Rational numbers can be converted back and forth between fraction and decimal forms by clicking on them.
Synthesize
Our programming language knows about many types of numbers, and they behave pretty much the way they do in math. Our Editor is also pretty smart, and can automatically switch between showing a rational number as a fraction or a decimal, just by clicking on it!
Order of Operations 30 minutes
Overview
Students are given a challenging expression that exposes common misconceptions about order of operations. The goal is to demonstrate that a brittle, fixed notion of order of operations is not good enough, and lead students to a deeper understanding of Order of Operations as a grammatical device. The Circles of Evaluation are introduced as "sentence diagramming for arithmetic".
Launch
Humans also use verbs like "throw", "run", "build" and "jump" to describe operations on these nouns. Mathematics has functions - or "operations" - like addition and subtraction, which are operations performed on values. Just as you can "spread mustard on bread", a person can also "add four and five".
A mathematical expression is like a sentence: it’s an instruction for doing something. The expression 4+5 tells us to add 4 and 5. To evaluate an expression, we follow the instructions in the expression. The expression 4 + 5 evaluates to 9.
 🖼Show image
Sometimes, we need multiple expressions to accomplish a task, and it will matter in which order they come. For exmple, if you were to write instructions for making a sandwich, it would matter very much which instruction came first: melting the cheese, slicing the bread, spreading the mustard, etc. The order of functions matters in mathematics, too.
🖼Show image
Sometimes, we need multiple expressions to accomplish a task, and it will matter in which order they come. For exmple, if you were to write instructions for making a sandwich, it would matter very much which instruction came first: melting the cheese, slicing the bread, spreading the mustard, etc. The order of functions matters in mathematics, too.
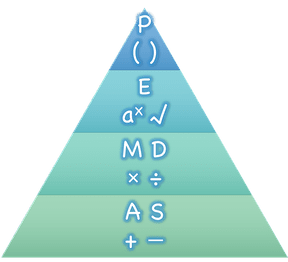
Mathematicians didn’t always agree on the order of operations, but now we have a common set of rules for how to evaluate expressions. The pyramid on the right summarizes the order. When evaluating an expression, we begin by applying the operations written at the top of the pyramid (multiplication and division). Only after we have completed all of those operations can we move down to the lower level. If both operations are present (as in 4 + 2 − 1), we read the expression from left to right, applying the operations in the order in which they appear.
But this set of rules is brittle, and doesn’t always make it clear what we need to do. Check out the expression below. What do you think the answer is? This math problem went viral on social media recently, with math teachers arguing about what the answer was! Why might they disagree on the solution?
6 ÷ 2(1 + 2)
Order of Operations mneumonic devices like PEMDAS, GEMDAS, etc focus on how to get the answer. What we need is a better way to read math.
Instead of a rule for computing answers, let’s start by diagramming the math itself! We can draw the structure of this grammer in mathematics using something called the Circles of Evaluation. The rules are simple:
1) Every Circle must have one - and only one! - function, written at the top
That means that Numbers (e.g. - 3, -29, 77.01…) are still written by themselves. It’s only when we want to do something like add, subtract, etc. that we need to draw a Circle.
2) The inputs to the function are written left-to-right, in the middle of the Circle.
If we want to draw the Circle of Evaluation for 6 ÷ 3, the division function (/) is written at the top, with the 6 on the left and the 3 on the right.
| / | ||
|
What if we want to use multiple functions? How would we draw the Circle of Evaluation for 6 ÷ (1 + 2)? Drawing the Circle of Evaluation for the 1 + 2 is easy. But how do divide 6 by that circle?
Circles can contain other Circles
We basically replace the 3 from our earlier Circle of Evaluation with another Circle, which adds 1 and 2!
| / | ||||||
|
If you’d like to have students practice connecting expressions with Circles of Evaluation before you move on to talking about code, turn to Completing Circles of Evaluation from Arithmetic Expressions (2) (Page 3), Creating Circles of Evaluation from Arithmetic Expressions (3) (Page 4), and/or Matching Circles of Evaluation and Arithmetic Expressions (Page 5) in the workbook.
Circles of Evaluation help us write code
When converting a Circle of Evaluation to code, it’s useful to imagine a spider crawling through the circle from the left and exiting on the right. The first thing the spider does is cross over a curved line (an open parenthesis!), then visit the operation - also called the function - at the top. After that, she crawls from left to right, visiting each of the inputs to the function. Finally, she has to leave the circle by crossing another curved line (a close parenthesis).
Expression |
→ |
3 + 8 |
||||
Circle of Evaluation |
→ |
(+ 3 8) |
||||
Code |
→ |
3 + 8 |
Practice creating Circles of Evaluation using the common operators (+, -, *, /).
-
Do spaces matter when typing in functions?
-
Does the order of the numbers matter in the functions? Which functions?
-
What do the error messages tell us?
-
What connections do you see between the expression, circle, and code?
Expression |
→ |
2 × (3 + 8) |
||||||||
Circle of Evaluation |
→ |
(* 2 (+ 3 8)) |
||||||||
Code |
→ |
2 * (3 + 8) |
Circles of Evaluation help us get the correct answer
Aside from helping us catch mistakes before they happen, Circles of Evaluation are also a useful way to think about transformation in mathematics. For example, you may have heard that "any subtraction can be transformed to a negative addition." For example, 1 - 2 can be transformed to 1 + -2.
Suppose someone tells you that 1 - 2 * 3 + 4 can be rewritten as 1 + -2 * 3 + 4. These two expressions will definitely give us the same answer, but this transformation is actually incorrect! It doesn’t use the negative addition rule at all! Take a moment to think: what’s the problem?
We can use the Circles of Evaluation to figure it out!
The first Circle is just the original expression. The multiplication happens first, so let’s see how multiplication changes this circle:
(+ (- 1 (* 2 3)) 4) |
multiplication → |
(+ (- 1 6) 4) |
As you can see, replacing the subtraction with a negative addition happens to the result of the multiplication. We can’t actually change the 2 into a -2, because it isn’t actually being subtracted from 1!
Sure, we got the same answer - but that doesn’t mean the way we got it was correct. If all that mattered was getting the right answer, we could just as easily have replaced the whole expression with 5 - 6. And that is definitely not a correct transformation!
Any time you make a transformation in math (replacing 10 - 2 with 8 because of subtraction, or replacing 2 + 6 with 6 + 2 because of commutativity), you need to make sure the transformation is correct. The Circles of Evaluation help us see these transformation visually, rather than forcing us to keep them in our heads.
Circles of Evaluation The Circles of Evaluation are a critical pedagogical tool in this course. They place the focus on the structure of mathematical expressions, as a means of combating the harmful student belief that the only thing that matters is the answer. They can be used to diagram arithmetic sentences to expose common misconceptions about Order of Operations, and make an excellent scaffold for tracing mistakes when a student applies the Order of Operations incorrectly. They are also a bridge representation, which naturally connects to function composition and converting arithmetic into code. |
Investigate
-
Students complete Arithmetic Expressions to Circles of Evaluation & Code (Page 9) page in their workbook. They should draw all of the Circles first and check their work, before converting to code.
-
Students complete the Translating Circles of Evaluation to Code (Page 7).
-
If time allows, partners should take turns entering the code into the editor.
-
Additional workook pages for translating Circles of Evaluation to code include Completing Partial Code from Circles of Evaluation (Page 6) and Matching Circles of Evaluation & Code (Page 8).
The Circles of Evaluation are a great way to visualize other functions you already know, such as square and square root!
Note: In Pyret, we treat operators like +, -, *, and / differently - they are written in between their inputs, just like in math. We also use letters instead of symbols for function names, so taking the square root is written as num-sqrt and squaring is written as num-sqr.
-
Students complete Translating Circles of Evaluation to Code - w/Square Roots (Page 10) with their partners and test their code in the editor.
Strategies For English Language Learners MLR 7 - Compare and Connect: Gather students' graphic organizers to highlight and analyze a few of them as a class, asking students to compare and connect different representations. |
Closing
Have students share back what they learned from the Circles of Evaluation. You may want to assign traditional Order of Operations problems from your math book, but instead of asking them simply to compute the answer - or even list the steps - have them draw the circle.
Additional Exercises
These materials were developed partly through support of the National Science Foundation,
(awards 1042210, 1535276, 1648684, and 1738598).  Bootstrap:Integrated Oklahoma by Jen Poole
is licensed under a
Creative Commons 4.0 Unported License.
Based on a work at www.BootstrapWorld.org.
Permissions beyond the scope of this license may be available by contacting
schanzer@BootstrapWorld.org.
Bootstrap:Integrated Oklahoma by Jen Poole
is licensed under a
Creative Commons 4.0 Unported License.
Based on a work at www.BootstrapWorld.org.
Permissions beyond the scope of this license may be available by contacting
schanzer@BootstrapWorld.org.
Domain and Range
Domain and Range
Students encounter String and Image datatypes and use "contracts" to make sense of the domain and range of functions.
Prerequisites |
|
Relevant Standards |
Select one or more standards from the menu on the left (⌘-click on Mac, Ctrl-click elsewhere). Oklahoma Standards
|
Lesson Goals |
Students will be able to:
|
Student-facing Goals |
|
Materials |
|
Preparation |
|
Key Points For The Facilitator |
|
Click here to see the prior unit-based version.
- contract
-
a statement of the name, domain, and range of a function
- datatypes
-
a way of classifying values, such as: Number, String, Image, Boolean, or any user-defined data structure
- definitions area
-
the left-most text box in the Editor where definitions for values and functions are written
- domain
-
the type or set of inputs that a function expects
- error message
-
information from the computer about errors in code
- function
-
a mathematical object that consumes inputs and produces an output
- Image
-
a type of data for pictures
- Number
-
a data type representing a real number
- range
-
the type or set of outputs that a function produces
- String
-
a data type for any sequence of characters between quotation marks (examples: "hello", "42", "this is a string!")
Contracts 15 minutes
Overview
This activity introduces the notion of Contracts, which are a simple notation for keeping track of the set all of possible inputs and outputs for a function. They are also closely related to the concept of a function machine, which is introduced as well. Note: Contracts are based on the same notation found in Algebra!
Launch
Students should open code.pyret.org (CPO) in their browser, and click "Sign In". This will ask them to log in with a valid Google account (Gmail, Google Classroom, YouTube, etc.), and then show them the "Programs" page. This page is empty - they don’t have any programs yet! Have them click "Open Editor".
For each input to a function, there is exactly one output
Source: Wikipedia
 🖼Show image
Functions are a lot like machines: values go in, something happens, and new values come out. Let’s start with an example of a function we all know: adding two numbers! Addition is like a machine that takes in pairs of numbers and produces a sum.
🖼Show image
Functions are a lot like machines: values go in, something happens, and new values come out. Let’s start with an example of a function we all know: adding two numbers! Addition is like a machine that takes in pairs of numbers and produces a sum.
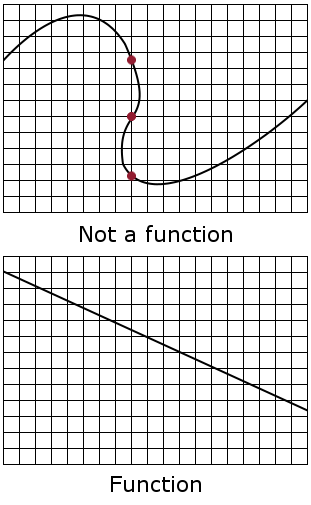
Consider the graphs on the right: for every input on the x-axis, a function will produce a single output. If we draw a vertical line and it hits the graph more than once, it means there is more than one output for the same input. Like any good machine, function machines must be reliable.
Whenever we use any machine, we always think about what goes in and what comes out. A coffee maker takes in coffee beans and water, and produces coffee. A toaster takes in bread and produces toast. We don’t have to know exactly how coffee makers or toasters work in order to use them. All we need to know is what type of thing goes in and what type of thing should come out!
In our coffee-maker example, we expect to get the exact same coffee out if we use the exact same beans and water each time. If you put bread in a toaster and got a bagel out, you’d be pretty surprised! Functions work the same way: no matter how many times you plug in the same number, you will always get the same result. And if you don’t? It’s not a function!
Investigate
We use something called a Contract to keep track of what goes in and out of these machines called functions. Contracts are like a "cheat sheet" for using functions. Once you know how to read one, you can quickly figure out how to use a function just by looking at its contract!
The Contract for a function has three parts: the Name of the function, the Domain, and the Range
-
The Name is simply how we refer to the function:
num-sqrt,num-sqr, etc. -
The Domain tells us what the function "takes in", or consumes. These are also known as the arguments to the function.
-
The Range tells us what the function "gives back", produces.
Memorizing contracts is hard, and why memorize when we can just keep a log of them! Let’s write them down so we can use them later! At the back of your workbook, you’ll find pages with space to write down every contract you see in the course.
-
What does Multiplication need as an input? What does it produce?
-
What inputs does the Square Root function consume? What does it produce?
-
When we Square something, what does the Square function consume and produce?
-
Write the contracts for
num-sqr, andnum-sqrtinto the Contracts page.
A Sample Contracts Table
| Name | Domain | Range | ||
|---|---|---|---|---|
|
:: |
|
-> |
|
|
:: |
|
-> |
|
|
:: |
|
-> |
|
|
:: |
|
-> |
|
It would be silly to buy a coffee-maker that only works with one specific coffee! Similarly, Contracts don’t tell us specific inputs. They tell us the Datatype of input a function needs. For example, a Contract wouldn’t say that addition requires "3 and 4". Addition works on more than just those two inputs! Instead, it would tells us that addition requires "two Numbers". When we use a Contract, we plug specific numbers into a mathematical expression.
Contracts are general. Expressions are specific.
Optional: Have students make a Domain and Range Frayer model and use the visual organizer to explain the concepts of Domain and Range in their own words.
Synthesize
-
What is wrong with the contract
# + : 3 4 -> 7? -
What is the difference between a value like
17and a type likeNumber?
Exploring Image Functions 25 minutes
Overview
Students explore functions that go beyond numbers, producing all sorts of simple geometric shapes and images in the process. Making images is highly motivating, and encourages students to get better at both reading error messages and persisting in catching bugs.
Launch
Students have already seen Number values like 42,-91, 1/4 or 0.25, but computer programs can work with a much larger set of datatypes. Show students examples of the String datatype, by having them type various things in quotation marks:
-
"hello" -
"many words, one string" -
"42" -
"1/3" -
Something students come up with on their own…
A String is anything in quotation marks. Like Number values, String values evaluate to themselves.
Here are two Circles of Evaluation. One of them is familiar, but the other very different from what you’ve seen before. What’s different about the Circle on the right?
|
(star 50 "solid" "blue") |
Possible responses:
-
We’ve never seen the function
starbefore -
We’ve never seen Strings used in a Circle of Evaluation before
-
We’ve never seen a function take in three inputs
-
We’ve never seen a function take in a mix of Numbers and Strings
Can you figure out the Name and Domain for the function in the second Circle? This is a chance to look for and make use of structure in deciphering a novel expression!
Possible responses:
-
We know the name of the function is
star, because that’s what is at the top of the circle -
We know it has three things in its Domain
-
We know the Domain consists of a Number and two Strings
-
But what about the Range? What do you think this expression will evaluate to?
-
Convert this Circle to code and try out!
-
What does the
50mean to the computer? Try replacing it with different values, and see what you get. -
What does the
"blue"mean to the computer? Try replacing it with different values, and see what you get. -
What does the
"solid"mean to the computer? Try replacing it with different values, and see what you get. If you get an error, read it! It just might give you a hint about what to do…
You’ve seen two datatypes already: Numbers and Strings. Did we get back either on of those? The Range of star is a datatype we haven’t seen before: an Image!
Error Messages The error messages in this environment are designed to be as student-friendly as possible. Encourage students to read these messages aloud to one another, and ask them what they think the error message means. By explicitly drawing their attention to errors, you will be setting them up to be more independent in the next activity! |
Suppose we had never seen star before. How could we figure out how to use it, using the helpful error messages?
-
Type
starinto the Interactions Area and hit "Enter". What did you get back? What does that mean? There is something called "star", and the computer knows it’s a function! -
If it’s a function, we know that it will need an open parentheses and at least one input. Have students try
star(50) -
What error did we get? What hint does it give us about how to use this function?
Investigate
-
Have students turn to Exploring Image Functions (Page 11) in the workbook.
-
Have students open a new program file and name it "Exploring Images".
-
On Line 1 of the Definitions area (left side), type the words include image and press "Run". (This loads the image library.)
Give students time to investigate image functions and see how many they can discover, using the Contracts page to organize their findings.
Strategies for English Language Learners MLR 2 - Collect and Display: As students explore, walk the room and record student language relating to functions, domain, range, contracts, or what they perceive from error messages. This output can be used for a concept map, which can be updated and built upon, bridging student language with disciplinary language while increasing sense-making. |
Synthesize
-
What image functions did you and your partner discover?
rectangle,triangle,ellipse,circle, etc. -
How did you decide what to try?
-
What error messages did you see? Input mismatches, missing parentheses, etc.
-
How did you figure out what to do after seeing an error message? Read the error message, think about what the computer is trying to tell us, etc.
Making Sense of Contracts 10 minutes
Overview
This activity digs deeper into Contracts, and has students create their own Contracts trackers to take ownership of the concept and create an artifact they can refer back to.
Launch
star has three elements in its Domain: A Number, a String, and another String.
-
What do these elements represent? The Number is the radius, the first String is the style (either
outlineorsolid), the second String is the color. -
What happens if I don’t give it those things? We won’t get the star we want, we’ll probably get an error!
-
If I give
starwhat it needs, what do I get in return? An Image of the star that matches the arguments -
squarehas the same Domain asstar. What do the arguments insquarerepresent? length, style, color -
Can different functions have the same Domain? The same Range? Are they still different functions? Yes, yes, and yes!
-
Can we come up with an example of two math functions that have the same Domain and Range?
When the input matches what the function consumes, the function produces the output we expect.
Where else have you heard the word "contract"? How can you connect that meaning to contracts in programming?
An actor signs a contract agreeing to perform in a film in exchange for compensation, a contractor makes an agreement with a homeowner to build or repair something in a set amount of time for compensation, or a parent agrees to pizza for dinner in exchange for the child completing their chores. Similarly, a contract in programming is an agreement between what the function is given and what it produces.
Investigate
-
Students complete Reading for Domain and Range (Page 12) with their partner.
Students create a visual "Contracts page" either digitally or physically. Ask students to think about how they visualize contracts in their own minds and how they could use that imagery to explain functions and their contracts to others.
Additional Exercises:
These materials were developed partly through support of the National Science Foundation,
(awards 1042210, 1535276, 1648684, and 1738598).
Bootstrap:Integrated Oklahoma by Jen Poole
is licensed under a
Creative Commons 4.0 Unported License.
Based on a work at www.BootstrapWorld.org.
Permissions beyond the scope of this license may be available by contacting
schanzer@BootstrapWorld.org.
Function Composition
Function Composition
Students encounter new image transformation functions and strengthen their understanding of Circles of Evaluation by using functions within other functions.
Prerequisites |
|
Lesson Goals |
Students will be able to:
|
Student-facing Goals |
|
Materials |
|
Supplemental Resources |
|
Preparation |
|
Key Points For The Facilitator |
|
Click here to see the prior unit-based version.
- circle of evaluation
-
a diagram of the structure of an expression (arithmetic or code)
- contract
-
a statement of the name, domain, and range of a function
- datatypes
-
a way of classifying values, such as: Number, String, Image, Boolean, or any user-defined data structure
- definitions area
-
the left-most text box in the Editor where definitions for values and functions are written
- function
-
a mathematical object that consumes inputs and produces an output
- Image
-
a type of data for pictures
- interactions area
-
the right-most text box in the Editor, where expressions are entered to evaluate
Composing Functions 20 minutes
Overview
Students are given a scaffolded activity that forces them to use the output of one function as the input to another - to compose them. The Circles of Evaluation are extended to provide a visual-spatial metaphor for function composition, in addition to Order of Operations.
Launch
Students should be logged into code.pyret.org and have their workbooks with a pen or pencil.
Divide students into groups of 3-4, and distribute a set of function cards to each group. Write down pairs of integers on the board, representing the "starting numbers" and "ending numbers". These integers should range from -50 to +50, but you can change the difficulty of the activity by making that span wider (more difficult) or more narrow (less difficulty). You can find a random integer generator here.
-
Each group has a set of functions, each of which takes an input and produces an output. I can start with the number
4, for example, and give it to the functionadd6. What will the output be? (10!) -
I can also compose functions, meaning that the output of one is immediately passed into another. For example, I could compose
add6anddouble, so the10gets passed into the next function, and doubled to produce20. What would happen if I composedadd6withdoubleand withhalf? (10!) -
For each of the starting numbers on the board, your job is to figure out which functions to compose in order to get to the end. You will need to use some functions more than once, and that’s ok!
Give students time to experiment with this. You can make the activity more challenging by asking them to find the shortest path from start to end, using the smallest number of compositions. If two groups come up with different compositions that achieve the same end result, have them share their ideas!
Investigate
The contracts page in your workbook is just like the Function Cards from this activity. Your job as a programmer is to figure out how to compose those functions to get where you want to go, in the most clever or elegant way possible.
Have students open to Composing Image Functions (Page 13). Students create a text image of their name and experiment with their choice of these new functions.
While students are exploring, be available for support but encourage student discussion to solve problems. Make sure students are using the Definitions area (left side) for code they want to keep and are using the Interactions area (right side) to test code or try out new ideas.
Many questions can be addressed with these responses:
-
Did you try drawing the Circle of Evaluation first?
-
Did you check the contract?
-
Have you pressed the Run button to save your Definitions changes?
Synthesize
-
What do all of these functions have in common? They all produce images, they all change some element of the original image
-
Does using one of these functions change the original image? No, it creates a whole new image
-
What does the number in
scalerepresent? The scale factor, the percent by which the image should grow or shrink -
What does the number in
rotaterepresent? The rotation angle, measured counterclockwise -
Suppose I wrote the code
scale(3, star(50, "solid", "red")).
What’s another line of code I could write that would produce the exact same image?*
star(150, "solid", "red")
-
The domain and range for
flip-horizontalis Image -> Image. Why can I use thetextfunction as an input forflip-horizontal? Because thetextfunction produces an Image, which is then used as the input forflip-horizontal.
Strategies for English Language Learners MLR 1 - Stronger and Clearer Each Time: As an alternative, display the discussion questions during the last 5 minutes of the Explore and ask students to discuss the questions with their partner, asking each other for explanation and details and coming up with the clearest, most precise answer they can. Student pairs can then share with another pair and compare their responses before moving into a full class discussion. |
Decomposing Image Problems 25 minutes
Overview
Students are given (simple, highly-structured) word problems involving creating images, and must map from the word problems to the names and order of functions needed to solve them. At this stage, the skill is quite brittle and hardly resembles the generalized problem-decomposition skill needed to solve complex word problems in algebra. This is merely the first introduction, and other lessons will deepen and broaden the idea.
Launch
Create the Circles of Evaluation and write the code for the following images. Write a new line of code for each exercise.
-
a solid, green
starof size 50 -
a solid, green
starthat is 3 times as large as the original (using thescalefunction) -
a solid, green
starthat is ½ the size of the original (using thescalefunction) -
a solid, green
starof size 50 that is rotated 45 degrees (using therotatefunction) -
a solid, green
starthat is 3 times as large as the original and rotated 45 degrees.
Investigate
Students complete Function Composition — Practice (Page 14), practicing drawing Circles of Evaluation and writing code with their partner using different functions.
When students are finished, check their work, and ask them to change the color of all of the stars to “gold” or another color of your choosing.
Create an Image that uses the text function and at least 3 of the following functions:
-
rotate -
scale -
overlay -
flip-horizontal -
flip-vertical -
any other image producing function (
triangle,star,circle,rectangle, etc..)
Students should practice writing comments in the code to describe what is being produced.
Use # at the beginning of a line to write a comment.
These materials were developed partly through support of the National Science Foundation,
(awards 1042210, 1535276, 1648684, and 1738598).
Bootstrap:Integrated Oklahoma by Jen Poole
is licensed under a
Creative Commons 4.0 Unported License.
Based on a work at www.BootstrapWorld.org.
Permissions beyond the scope of this license may be available by contacting
schanzer@BootstrapWorld.org.
Defining Values
Defining Values
Students learn how to define lines of code as a set value that can be used repeatedly in different situations, similar to a variable in math.
Prerequisites |
|
Relevant Standards |
Select one or more standards from the menu on the left (⌘-click on Mac, Ctrl-click elsewhere). Oklahoma Standards
|
Lesson Goals |
Students will be able to:
|
Student-facing Goals |
|
Materials |
|
Preparation |
|
Key Points For The Facilitator |
|
Click here to see the prior unit-based version.
- contract
-
a statement of the name, domain, and range of a function
- datatypes
-
a way of classifying values, such as: Number, String, Image, Boolean, or any user-defined data structure
- definitions area
-
the left-most text box in the Editor where definitions for values and functions are written
- value
-
a specific piece of data, like 5 or "hello"
- variable
-
a letter, symbol, or term that stands in for a value or expression
What’s in Common? 30 minutes
Overview
This activity introduces the problem with duplicate code, leveraging Mathematical Practice 7 - Identify and Make Use of Structure. Students identify a common structure in a series of expressions, and discover how to bind that expression to a name that can be re-used.
Launch
Students should be logged into code.pyret.org.
Take a look at the expressions below:
star(50, "solid", "green")
scale(3, star(50, "solid", "green"))
scale(0.5, star(50, "solid", "green"))
rotate(45, star(50, "solid", "green"))
rotate(45, scale(3, star(50, "solid", "green")))-
What code do they all have in common?
star(50, "solid", "green") -
What would happen if you were asked to change the color of all the stars to gold? We’d have to change it everywhere it appeared.
Duplicate code is almost always bad!
There are lots of potential problems with duplicate code:
-
Readability: The more code there is, the harder it can be to read.
-
Performance: Why re-evaluate the same code a dozen times, when we can evaluate it once and use the result as many times as we need?
-
Maintainability: Suppose we needed to change the size of the stars in the examples above. We would have to make sure every line is changed, which leaves a lot of room for error.
Since we’re using that star over and over again, wouldn’t it be nice if we could define a "nickname" for that code, and then use the nickname over and over in place of the expression?
Investigate
You already know how to do this in math: x = 4 + 2 evaluates the expression, and defines the nickname x to be the value 6.
Pyret is no different! We type x = 4 + 2 to define x to be the value 6.
-
Start a new program, and type this code into the Interactions Area.
-
What happens when you hit Enter?
-
Can you explain what happened or didn’t happen?
Expressions evaluate to answers. Definitions don’t.
Think back to math: x = 4 + 2 doesn’t have an "answer". All it does is tell us that anytime we see x, we know it stands for 6. We only see a result when we use that definition, for example x × 5 will evaluate to 30.
On the computer, try using the definition of x by multiplying it by 5.
-
What is the usefulness of defining values? Lets the programmer reuse code, saves time, lets the programmer make changes easily, allows us to more easily use elements inside other functions
-
What datatypes can we define values for? All of them - Number, String, Image
Support for English Language Learners MLR 8 - Discussion Supports: As students discuss, rephrase responses as questions and encourage precision in the words being used to reinforce the meanings behind some of the programming-specific language, such as "define" and "value". |
Of course, the whole point of defining a value is so that it sticks around and can be used later! That’s why programmers put their definitions on the left-hand side, known as the Definitions Area.
-
Complete Defining Values - Explore (Page 16) in your student workbook. What else can you define?
-
Complete Defining Values - Practice (Page 17) with their partner.
Cleaning Up Code 20 minutes
Overview
This activity is a chance to play with new concepts, combining value definitions and function composition to create new shapes or to clean up code that generates shapes. The engaging nature of the activity is designed to motivate lots of experiments, each of which gives students a chance to practice applying those concepts.
Launch
The ability to define values allows us to look for - and make use of - structure in our code or in our equations. What structure is repeated in this expression?
(x + 1)^2 - 4/( (x + 1) ) × -2(x + 1)
Investigate
Have students open this file , which draws the Chinese flag.
-
This file uses a function students haven’t seen before! What is it?
-
What is it its contract?
-
Have them change the color of all the stars from yellow to black
-
Have them identify what structure is repeated
-
Have them use a value definition to simplify the code
-
Have them change the stars from black back to yellow
Optional (for a longer time commitment):
Have students choose a flag from this list of images: (Flags of the World), and recreate one (or more!) of the flags using define and any of the other functions they’ve learned so far.
Synthesize
How many reasons can students come up with for why defining values is useful?
These materials were developed partly through support of the National Science Foundation,
(awards 1042210, 1535276, 1648684, and 1738598).
Bootstrap:Integrated Oklahoma by Jen Poole
is licensed under a
Creative Commons 4.0 Unported License.
Based on a work at www.BootstrapWorld.org.
Permissions beyond the scope of this license may be available by contacting
schanzer@BootstrapWorld.org.
Making Flags
Making Flags
Students compose the image functions they’ve learned, applying their knowledge of coordinates to position differently-shaped and transformed images to create flags of varying complexity.
Prerequisites |
|
Relevant Standards |
Select one or more standards from the menu on the left (⌘-click on Mac, Ctrl-click elsewhere). Oklahoma Standards
|
Lesson Goals |
Students will be able to:
|
Student-facing Goals |
|
Materials |
|
Preparation |
|
Key Points For The Facilitator |
|
- contract
-
a statement of the name, domain, and range of a function
Putting Images Together 15 minutes
Overview
Students learn about the put-image function.
Launch
You already know how to place one image on top of another, using the overlay function.
Open the Flags Starter File , and click Run.
There’s some code in the Definitions Area you haven’t seen before. For now, just focus on lines 4 and 5 in the code. What do these lines of code do?
Evaluate dot and blank in the Interactions Area. What do you get?
How could we overlay the dot on top of the blank rectangle image? What image do we get back?
As you’ve seen, overlay stick two images together, so that the center of the first image is placed exactly on top of the center of the second image. But what if we want to put the dot somewhere besides the center?
Investigate
-
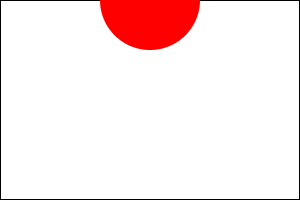
Type
japaninto the Interactions Area. What do you get back? -
Take a look at the code on line 7. What function is being used here?
-
Try changing the
150to50, then click Run. How does this image change? -
Try changing the
50to0, then click Run. How does this image change? -
What is the Contract for
put-image? (Write it in your Contracts page!) -
What does the
put-imagefunction do?
The put-image function works like overlay, but instead of placing the centers of each image on top of one another, it translates the center of the top image by some distance in the x- and y-direction.
Think of the bottom image as a sheet of graph paper
The numbers in put-image specify a point on that graph paper, with the center of the top image being placed there.
The width of the rectangle is 300 and height is 200. Estimate: What coordinates for the dot would create each of the following images?


Complete Combining Images (Page 18).
Synthesize
Could we completely replace overlay with put-image? Why or why not?
Making Flags 25 minutes
Overview
Students focus on decomposing complex images into simple ones, and using put-image to combine them.
Launch
Let’s dig into the process for how the japan was made:
1) Decompose the Image
We observe that the Japanese flag is made up of two simpler images: a blank rectangle and a red dot.
2) Define those parts
We define dot and blank. Once we’ve defined those images, we test them out in the Interactions Area to make sure they look right!
3) Find the Coordinates
For each image, calculate what the x- and y-coordinates of the center should be. TIP: this is a lot easier if you have a sheet of graph paper handy!
4) Build the Image
We stack the parts on top of the bottom image using the coordinates we found. TIP: don’t cram all the code into one line! If you break it up into new lines (for example, hitting "Return" before the x-coordinate and after the y-coordinate), you’ll notice that the code forms a "staircase" pattern.
Investigate
-
Turn to Decomposing Flags (Page 19), and choose ONE flag to focus on. On the blank lines below, describe the parts that make up that flag.
-
Once you’re done, return to the Flags Starter File and define those parts.
-
Then, compose those parts using
put-image, and make your flag!
Ratio and Proportion Have students define the |
Synthesize
Which flags were the easiest to make? The hardest?
Why is it useful to define each part of the flag first, before stitching them together?
These materials were developed partly through support of the National Science Foundation,
(awards 1042210, 1535276, 1648684, and 1738598).
Bootstrap:Integrated Oklahoma by Jen Poole
is licensed under a
Creative Commons 4.0 Unported License.
Based on a work at www.BootstrapWorld.org.
Permissions beyond the scope of this license may be available by contacting
schanzer@BootstrapWorld.org.
Defining Functions
Defining Functions
Students discover functions as an abstraction over a programming pattern, and are introduced to a structured approach to building them called the Design Recipe.
Prerequisites |
|
Lesson Goals |
Students will be able to:
|
Student-Facing Lesson Goals |
|
Materials |
|
Preparation |
|
Key Points for the Facilitator |
|
Click here to see the prior unit-based version
- contract
-
a statement of the name, domain, and range of a function
- definitions area
-
the left-most text box in the Editor where definitions for values and functions are written
- design recipe
-
a sequence of steps that helps people document, test, and write functions
- example
-
shows the use of a function on specific inputs and the computation the function should perform on those inputs
- function
-
a mathematical object that consumes inputs and produces an output
- Number
-
a data type representing a real number
- syntax
-
the set of rules that defines a language, whether it be spoken, written, or programmed.
Identifying Repeated Patterns 30 minutes
Overview
As with the Defining Values lesson, students search for structure in a list of expressions. But this time, the structures are dynamic, meaning they change in a predictable way. This is the foundation for defining functions.
Launch
Students should have their workbook, pencil, and be logged into code.pyret.org on their computer.
I Love Green Triangles
 🖼Show image
I Love Green Triangles
 🖼Show image
Confess to your students, "I LOVE green triangles." Challenge them to use the Definitions area to make as many DIFFERENT solid green triangles as they can in 2 minutes.
Walk around the room and give positive feedback on the green triangles. After the 2 minutes, ask for some examples of green triangles that they wrote and copy them to the board. Be specific and attend to precision with the syntax such that students can visually spot the pattern between the different lines of code.
For example:
triangle(30,  "solid", "green")
triangle(12,  "solid", "green")
triangle(500, "solid", "green")
Notice and Wonder Direct students to the various lines of code they came up with. What do you notice? What do you wonder? |
-
Is there a pattern? Yes, the code mostly stayed the same with one change each time.
-
What stayed the same? The function name
triangle, "solid", "green". -
What changed? The number being given to
triangle, or the Number input. -
What strategy did you use to create many different triangles? Answers vary: Pattern matching, copy and paste
-
What shortcut did we use before when we wanted to use the same code over and over?
We defined values in the Definitions area.
We’ve learned how to define values when we want to create a shortcut to reuse the same code over and over.
For example:
myStar = star(50, "solid", "gold")
But to make a shortcut that changes such as creating solid, green triangles of a changing size, we need to define a function.
Suppose we want to define a shortcut called gt. When we give it a number, it makes a solid green triangle of whatever size we gave it.
Select a student to act out gt. Make it clear to the class that their Name is "gt", they expect a Number, and they will produce an Image. Run through some sample examples before having the class add their own:
-
You say: gt 20! The student responds: triangle(20, "solid", "green")!
-
You say: gt 200! The student responds: triangle(200, "solid", "green")!
-
You say: gt 99! The student responds: triangle(99, "solid", "green")!
We need to program the computer to be as smart as our volunteer. But how do we do that?
Investigate
Let’s walk through an example of defining gt. Turn to Fast Functions (Page 21).
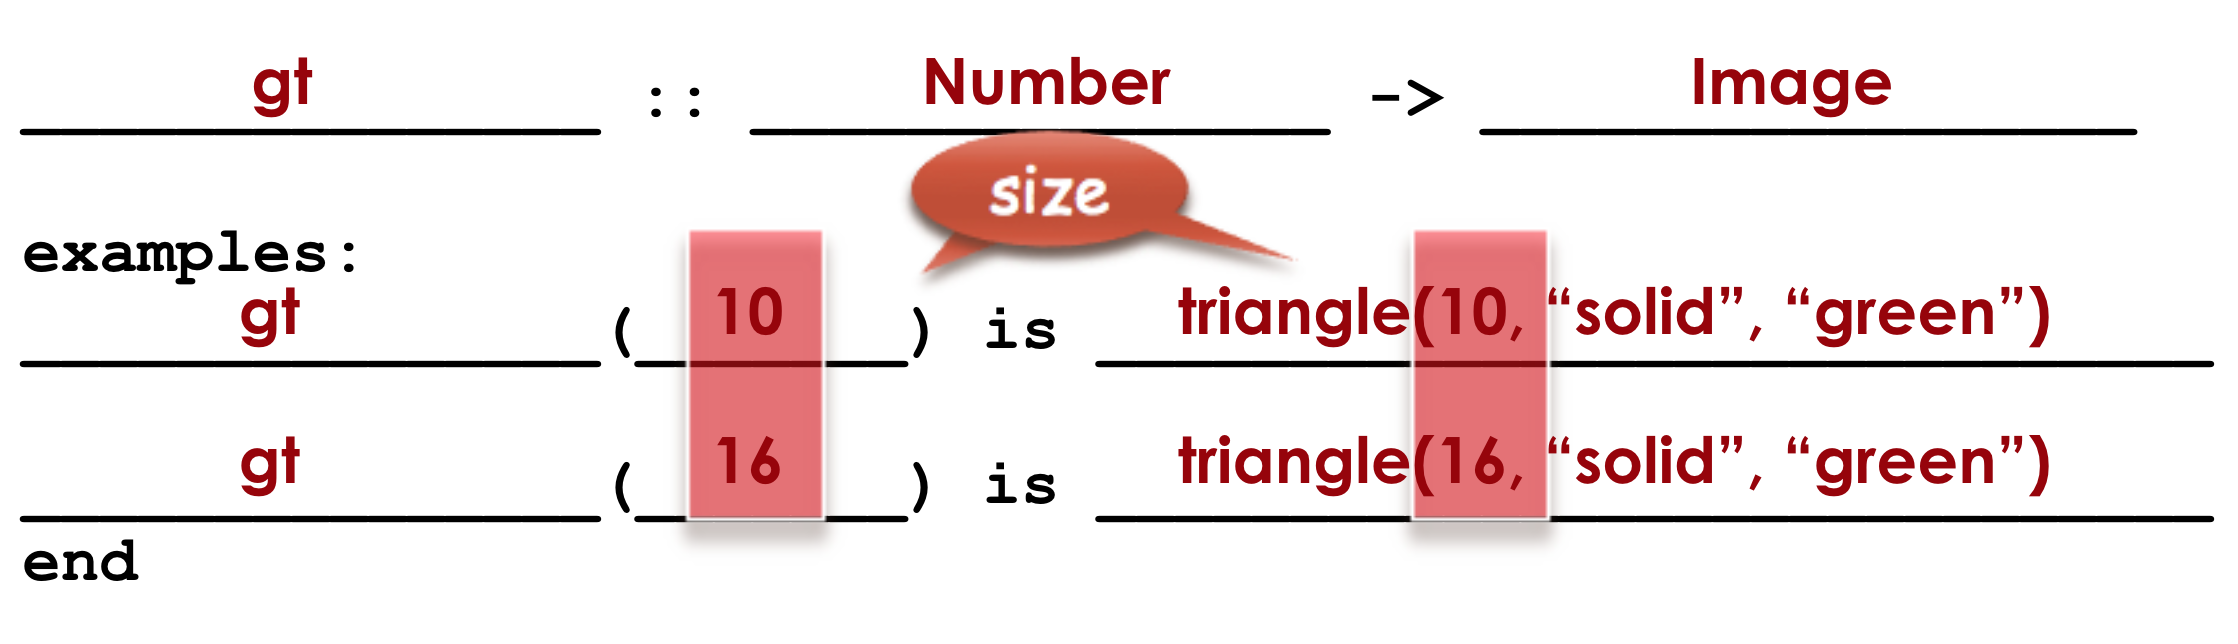
Word Problem: Write a function called gt that takes in a Number and produces a solid, green triangle of that given size.
Have students follow along on the Fast Functions (Page 21) workbook page.
1. Write the contract for this new function by looking at the word problem.
- What does gt take in?
- A Number
-
What does
gtgive back? -
An Image. Students may say "a triangle", follow up by asking what data type that triangle will be (Number, String, or Image)
2. Write some examples of how this function should work.
- If I typed
gt(40)
, what would I want the program to do?
- I’d want the computer the execute the code
triangle(40, "solid", "green").
(This is a tough question at first. If students are unsure, remind them that we’re just writing a shortcut for making green triangles so we don’t have to type triangle, "solid", and "green" every time!)
-
OPTIONAL: Have students turn back to Page 20 worksheet, showing how their function examples are working.
3. Circle and Label what is "change-able" - or variable between the examples. Circle and label it with a name that describes it.
The number is changing in each example. We could name it "x", but "size" is a more accurate name.
Circle and label what is changing
 🖼Show image
4. Write the function definition.
Look at the two examples. The function definition will follow the same pattern, but it will use the variable name size in place of the variable part we circled. We also use the keyword fun, replace the colon (is) with a colon (:), and finish it off with an end.
fun gt(size): triangle(size, "solid", "green") end
Connecting to Best Practices - Writing the examples is like "showing your work" in math class. - Have students circle what is changing and label it with a proper variable name. The name of the variable should reflect what it represents, such as - Writing examples and identifying the variables lays the groundwork for writing the function, which is especially important as the functions get more complex. Don’t skip this step! |
Have students type the Contract, Examples, and Definition of gt into a new WeScheme program (in the Definitions Area!), save their program as 'Defining Functions' and test out gt in the Interactions window.
Fast Functions (Page 21) includes another sample problem at the top. Can students fill out the page to define bc?
Synthesize
-
What is the domain for
gt? Number -
Why might someone think the domain for
gtcontains a Number and two Strings, because that’s the Domain oftriangle? The functiongtusestriangle, but only needs one Number input because that’s the only part that’s changing. -
Why is defining functions useful to us as programmers?
Practicing the Design Recipe flexible
Overview
This is a chance for students to independently review the steps learned in the prior activity, with the teacher in a supporting role asking guiding questions and giving support when needed.
Launch
Word Problem: Write a function called gold-star that takes in number and produces a solid, gold star of that given size.
-
Write 2 examples and the definition of
gold-staron the 'Fast Functions' handout. -
Complete the
gold-starexample on the Fast Functions (Page 21) worksheet.
Investigate
-
Design a problem for a function that takes in one input and returns a shape that uses that input. Your function’s input could be a Number, as in the two examples, or a String.
-
Write two examples and a definition for your function
-
Complete the Mapping Examples with Circles of Evaluation (Page 20) for the examples of your function.
Synthesize
The Design Recipe is a powerful tool for solving word problems. In this lesson, students practiced using it on simple programming problems, but soon they’ll be applying it to traditional math problems. Encourage them to make this connection on their own: can they think of a math problem in which this would be useful?
Additional Exercises:
These materials were developed partly through support of the National Science Foundation,
(awards 1042210, 1535276, 1648684, and 1738598).
Bootstrap:Integrated Oklahoma by Jen Poole
is licensed under a
Creative Commons 4.0 Unported License.
Based on a work at www.BootstrapWorld.org.
Permissions beyond the scope of this license may be available by contacting
schanzer@BootstrapWorld.org.
Solving Word Problems
Solving Word Problems
Students discover functions as an abstraction over an arithmetic pattern, applying the Design Recipe to traditional word problems.
Prerequisites |
|
Relevant Standards |
Select one or more standards from the menu on the left (⌘-click on Mac, Ctrl-click elsewhere). Oklahoma Standards
|
Lesson Goals |
Students will be able to:
|
Student-Facing Lesson Goals |
|
Materials |
|
Preparation |
|
Supplemental Resources |
|
Key Points for the Facilitator |
|
Click here to see the prior unit-based version
- contract
-
a statement of the name, domain, and range of a function
- datatypes
-
a way of classifying values, such as: Number, String, Image, Boolean, or any user-defined data structure
- design recipe
-
a sequence of steps that helps people document, test, and write functions
- domain
-
the type or set of inputs that a function expects
- function
-
a mathematical object that consumes inputs and produces an output
- purpose statement
-
a brief description of what a function does
- range
-
the type or set of outputs that a function produces
Writing Linear Functions 25 minutes
Overview
Students are given a non-working program, which uses a linear function to determine the height of a rocket after a given length of time. The "broken" code is provided to lower cognitive load, allowing students to focus on comprehension (reading the code) and making use of structure (identifying where it’s broken).
Launch
Students should have their workbook, pencil, and be logged into code.pyret.org on their computer.
Ask students to open the
rocket-height Starter File and click "Run". By typing start(rocket-height), they will see the simulation start to run on their computer.
Notice and Wonder What do you notice about this program? What do you wonder? |
Survey the class on their "Notices" and "Wonders" and record on the board before moving on to the discussion.
-
Is
rocket-heightworking? -
Why do you think it’s not working?
-
What do you think the purpose of this function is? How do you know?
-
What is the domain of
rocket-height? Number -
What is the range of
rocket-height? How do you know? Number, we can tell by looking at the contract for the function. -
As the program is currently written, what happens when I give the function an input of 5? 15? One million? It always returns 0.
You’ve started to master most of the steps of the Design Recipe, but there’s one part you haven’t seen yet: writing a purpose statement. Programmers and Mathematicians alike find it helpful to restate a problem in their own words. After all, if you can’t explain a problem to someone else, you probably don’t understand it yourself!
Investigate
Let’s use the Design Recipe to fix rocket-height, and get comfortable with writing purpose statements.
-
Have students turn to Word Problem: rocket-height (Page 22) and read the problem statement with their partner.
-
Now that the students have revised and refined their purpose statement, have them write the Contract and purpose statement on Word Problem: rocket-height (Page 22) worksheet.
-
Given the contract and purpose statement, write two examples of how
rocket-heightshould work after two different lengths of time. -
Circle and label what’s changing in the two examples, just as they did with their green triangle function before.
-
Choose a good variable name for what’s changing.
-
Write the function definition using the variable name.
-
Once the Design Recipe has been completed in the workbook, students can type the code into the
rocket-heightprogram, replacing any incorrect code with their own code.
Synthesize
-
What was the problem?
-
What mistake did the programmer make?
-
Where in the Design Recipe did they first go astray?
The Design Recipe allows us to trace mistakes back to the source!
More Interesting Functions flexible
Overview
For teachers who cover quadratic and exponential functions, this activity deepens students' understanding of functions and extends the Design Recipe to include those. This can also be a useful activity for students who finish early, or who need more of a challenge.
Launch
Now that rocket-height is working correctly, explore the rest of the file and try the following:
-
Remove the comment from before the
(start rocket-height)and test the program. -
Put the comment back in front of
(start rocket-height), remove the comment from(graph rocket-height), and test the program. -
Try out
(space rocket-height) -
Try out
(everything rocket-height)
Investigate
-
Can you make the rocket fly faster? Slower?
-
Can you make the rocket sink down instead of fly up?
-
Can you make the rocket accelerate over time, so that it moves faster the longer it flies?
-
Can you make the rocket blast off and then land again?
-
Can you make the rocket blast off, reach a maximum height of exactly 1000 meters, and then land?
-
Can you make the rocket blast off, reach a maximum height of exactly 1000 meters, and then land after exactly 100 seconds?
-
Can you make the rocket fly to the edge of the the universe?
Synthesize
Debrief - what did students try? Have students share their experiments with one another!
Additional Exercises:
These materials were developed partly through support of the National Science Foundation,
(awards 1042210, 1535276, 1648684, and 1738598).
Bootstrap:Integrated Oklahoma by Jen Poole
is licensed under a
Creative Commons 4.0 Unported License.
Based on a work at www.BootstrapWorld.org.
Permissions beyond the scope of this license may be available by contacting
schanzer@BootstrapWorld.org.
Restating the Problem
Restating the Problem
Students apply their skills in using the Design Recipe and writing purpose statements to a variety of word problems.
Prerequisites |
|
Relevant Standards |
Select one or more standards from the menu on the left (⌘-click on Mac, Ctrl-click elsewhere). Oklahoma Standards
|
Lesson Goals |
Students will be able to:
|
Student-Facing Lesson Goals |
|
Materials |
|
Preparation |
|
Key Points for the Facilitator |
|
Click here to see the prior unit-based version
- datatypes
-
a way of classifying values, such as: Number, String, Image, Boolean, or any user-defined data structure
- debug
-
to find and fix errors in one’s code
- design recipe
-
a sequence of steps that helps people document, test, and write functions
- domain
-
the type or set of inputs that a function expects
- example
-
shows the use of a function on specific inputs and the computation the function should perform on those inputs
- function
-
a mathematical object that consumes inputs and produces an output
- purpose statement
-
a brief description of what a function does
- range
-
the type or set of outputs that a function produces
Focusing on Purpose Statements 30 minutes
Overview
This lesson is all about practice with word problems, focusing on the specific skill of writing a good purpose statement. Students practice with the Design Recipe and writing quality Purpose Statements. This can be done with their usual coding partner, a new partner, a station review, or another format that suits the class.
Launch
Students should have their workbook, pencil, and be logged into code.pyret.org on their computer.
Students will use the Purpose Statement organizer (Page 23) and the Design Recipe worksheets to work through different practice problems from workbook.
Strategies for Reading Comprehension MLR 6: 3 Reads - In pairs, the word problem is read 3 times. Students will document their work in the "3 Reads/Stronger & Clearer" handout. - 1st Read: Teacher reads the word problem. Without any pencil or pen, students discuss: What is the problem about? - 2nd Read: Partner A reads. Students discuss: What are the quantities? - 3rd Read: Partner B reads. What is a good purpose statement? MLR 1: Stronger and Clearer Each Time - Using the "3 Reads + Stronger & Clearer" handout, students will switch partners 3 times. - Response 1: Write (and/or draw!) your understanding of the word problem. - Structured Meetings: Meet with another student, and share 1st drafts. Ask clarifying questions and make suggestions of one another, taking notes (repeat with additional meetings as necessary). - Response 2: Write a second draft, demonstrating your understanding of the word problem. |
Students may choose to use the programming environment to test out their functions or experiment with different strategies. Encourage students to try different strategies and debug their own programs as much as possible.
-
What strategies did you find the most helpful in solving these problems? Encourage student discussion while making notes of preferred strategies on the board.
-
Did any groups disagree on how to solve a problem? What did you do to resolve this?
-
*How can reading a word problem three times help you? Helps you to slow down and comprehend, makes time to look for information, gives you a chance to catch something you missed the first time, etc.
-
Where else can you use the strategies we practiced today?
Investigate
Have students break into teams of 2-4, and use the Design Recipe to solve at least three word problems. We recommend using some of the sample word problems provided in the workbook (see below), but you can also grab any word problem from your math book in which students must define a functional relationship.
Optional: Ask students to create their own appropriately challenging word problem (with a solution) and collect the responses for later use as "Do Now" tasks or formative assessment.
Synthesize
Which step in the Design Recipe are students feeling the most confident about? The least? At this stage, it is normal for students to feel most confident about the Contract and Examples, and the least confident about Purpose Statements and Definitions.
Design Recipe Games 20 minutes
Overview
The Design Recipe is essentially a systematic way to formalize an unstructured word problem into a structured solution, and each phase formalizes it more than the one that came before it. These activities help students focus on the rigor of each step, and the way those steps are connected. The strategies introduce here can be used in later lessons, and we strongly recommend using at least one of them for every subsequent lesson!
Launch
The Design Recipe makes it possible to solve a problem in pieces, and to see how those pieces fit together. For hard problems, knowing how the parts fit together will let you use each step to help you write the next one.
These two activities will involve relatively easy word problems, so the challenge isn’t about solving them! It’s figuring out how the pieces fit together and making sure all of the solutions make sense. Once you know how everything fits together, you’ll be able to make fewer mistakes - and even check your work when you do!
Investigate
Design Recipe Telephone
-
Divide the class into groups of three.
-
Choose three word problems (we’ll call them Problems A, B and C) to give to each group. You can use ones from your textbook, or any of the practice word problems in the workbook that students haven’t solved before.
-
In every group, each student is given their own word problem. Student 1 writes the Contract and Purpose for Problem A, Student 2 writes the Contract and Purpose for Problem B, and so on.
-
Once they’re done, students should get rid of the word problems by handing them back to the teacher, folding them over, etc. Then they pass their paper to the right so that Student 1 is now looking at the Contract and Purpose for Problem C, Student 2 is looking at the Contract and Purpose for Problem A, and Student 3 is looking at Problem B.
-
Based solely on the Contract and Purpose, each student must now write two Examples, as well as circle and label what is changing. If the Contract and Purpose don’t provide enough information, they pass the paper back and the original author has to re-do them.
-
Once they’re done, students get rid of the Contract and Purpose by folding them over. Then they they pass their paper to the right again, so that Student 1 is now looking at the Examples for Problem B, Student 2 is looking at the Contract and Purpose for Problem C, and Student 3 is looking at Problem A.
-
Based solely on the Examples (and the circles-and-labeled variables), students must derive the function definition. If the Examples don’t provide enough information, they pass the paper back and the original author has to re-do them.
This activity can be repeated several times, or done as a timed competition between teams. The goal is to emphasize that each step - if done correctly - makes the following step incredibly simple.
Where’d You Get That?
Divide the class into pairs, giving each pair two word problems (the whole class can use the same set, or different ones), and have students solve one problem each independently. Once finished, students take turns challenging each other. The Challenger always starts at the bottom of the page, physically pointing to one part of the function definition and asking "where’d you get that?" The Defender has to physically point to some location in the Examples, and explain exactly how they got that part of the definition. This is repeated for every other step in the recipe, as students work their way back to the original word problem. For example:
-
Challenger (pointing at variable in the Definition): Where’d you get that?
-
Defender (pointing at label in the Examples): Well, I circled the parts of the Examples that change, and gave them that label.
-
Challenger (pointing at the label): OK, but where did you get the label?
-
Defender (pointing at Purpose Statement): I used that term in the Purpose Statement.
-
Challenger (pointing at Purpose Statement): Where’d you get that term?
-
Defender (pointing to Word Problem): I got it from reading the Word Problem.
Common Misconceptions
Mathematically confident students will actively resist these activities, because they may be used to having the answer come to them almost as soon as they finish reading the word problem (this is the same objection those students have to explaining "how they got the answer").
Synthesize
The Design Recipe is a way of slowing down and thinking through each step of a problem. If we already know how to get the answer, why would it ever be important to know how to do each step the slow way?
Sample Responses:
-
Someday we won’t be able to get the answer, and knowing the steps will help
-
So we can help someone else who is stuck
-
So we can work with someone else and share our thinking
-
So we can check our work
These materials were developed partly through support of the National Science Foundation,
(awards 1042210, 1535276, 1648684, and 1738598).
Bootstrap:Integrated Oklahoma by Jen Poole
is licensed under a
Creative Commons 4.0 Unported License.
Based on a work at www.BootstrapWorld.org.
Permissions beyond the scope of this license may be available by contacting
schanzer@BootstrapWorld.org.
Character Animation
Character Animation
Students define functions that control the movement of the target and danger in their games
Prerequisites |
|
Relevant Standards |
Select one or more standards from the menu on the left (⌘-click on Mac, Ctrl-click elsewhere). Oklahoma Standards
|
Lesson Goals |
Students will be able to:
|
Student-Facing Lesson Goals |
|
Materials |
|
Preparation |
|
Key Points for the Facilitator |
|
Click here to see the prior unit-based version
- coordinate
-
a number or set of numbers describing an object’s location
- design recipe
-
a sequence of steps that helps people document, test, and write functions
- function
-
a mathematical object that consumes inputs and produces an output
Animation 45 minutes
Overview
Students connect the behavior of functions with changing coordinate values, ultimately leading to animation.
Launch
Students should have their computer, contracts page, and pencil. Students should have their own game file open in a separate window or tab.
-
How does a flip-book animation work? Each page of the book is slightly different, and the pages go so fast that the motion looks smooth.
-
Why do we see movement from still images?
Our eyes fill in the gaps between rapidly changing images. -
How might this apply to our game?
If we change image coordinates a little bit at a time, they will appear to move.
Draw a number line on the board, running from 0 to 1000 (you can also lay tape on the floor, or use a tile floor as a coordinate plane!). Select 2 student volunteers - one to be TARGET, one to be DANGER. Start with just TARGET.
-
Have the class select a starting x-coordinate for the
TARGET, and have the volunteer move to that position on the number line or coordinate plane. -
The TARGET character moves by 50 (pixels) on each frame of the game.
-
When they hear "update target" followed by their current location, the
TARGETtakes a step in the negative direction, moving down the x-axis by 50 (pixels). -
We make TARGET move by calling out
update-target(300),update-target(250), etc.
How quickly could I get TARGET to move across the classroom?
After practicing with TARGET, add DANGER in.
-
DANGERtakes a step in the positive direction when they hear "update danger" followed by their current x-coordinate. -
We make
DANGERmove by calling outupdate-danger(40),update-danger(39), etc. -
On a standard number line, if the
DANGERis moving to the right, is its x-coordinate increasing or decreasing?
Practice this a few times with your volunteer, asking the class what their new x-coordinate is each time. Then have the other students call the update-danger function.
-
What did you notice about the movement of TARGET and DANGER? What was changing about them?
Answers will vary: they were moving horizontally, their x-coordinates were changing, they were not moving smoothly, etc.
-
What jobs could we hand over to the computer to make it possible for us to play the game? The computer could handle automatically moving TARGET and DANGER, then we could control the movement of PLAYER.
Investigate
-
Have students examine the
update-dangerfunction in their Game Starter File, identify the contract, and interpret what the function is currently doing. -
Guide students as they complete the first word problem on Danger and Target Movement (Page 31), and transfer the code to their Game Starter File.
When students press the Run button, the working update-danger function should automatically move the DANGER image across the screen!
Have students complete the second word problem on Danger and Target Movement (Page 31), with their partner and transfer the code to their Game Starter File. Press Run to see DANGER and TARGET move across the screen independently!
Extension Activities Once students have successfully gotten Want 2-D movement? A supplemental lesson linked here provides information on how to modify these functions to allow movement in the x and y directions! |
These materials were developed partly through support of the National Science Foundation,
(awards 1042210, 1535276, 1648684, and 1738598).
Bootstrap:Integrated Oklahoma by Jen Poole
is licensed under a
Creative Commons 4.0 Unported License.
Based on a work at www.BootstrapWorld.org.
Permissions beyond the scope of this license may be available by contacting
schanzer@BootstrapWorld.org.
Problem Decomposition
Problem Decomposition
Students take a closer look at how functions can work together by investigating the relationship between revenue, cost, and profit.
Prerequisites |
|
Relevant Standards |
Select one or more standards from the menu on the left (⌘-click on Mac, Ctrl-click elsewhere). Oklahoma Standards
|
Lesson Goals |
Students will be able to:
|
Student-Facing Lesson Goals |
|
Materials |
|
Preparation |
|
Key Points for the Facilitator |
|
- function
-
a mathematical object that consumes inputs and produces an output
Problem Decomposition 30 minutes
Overview
Students are introduced to word problems that can be broken down into multiple problems, the solutions to which can be composed to solve other problems. They adapt the Design Recipe to handle this situation.
Launch
Students should have their workbook, pencil, and be logged into code.pyret.org and have their workbooks with a pen or pencil.
Display the following image:
Lemonade Stand Ideas
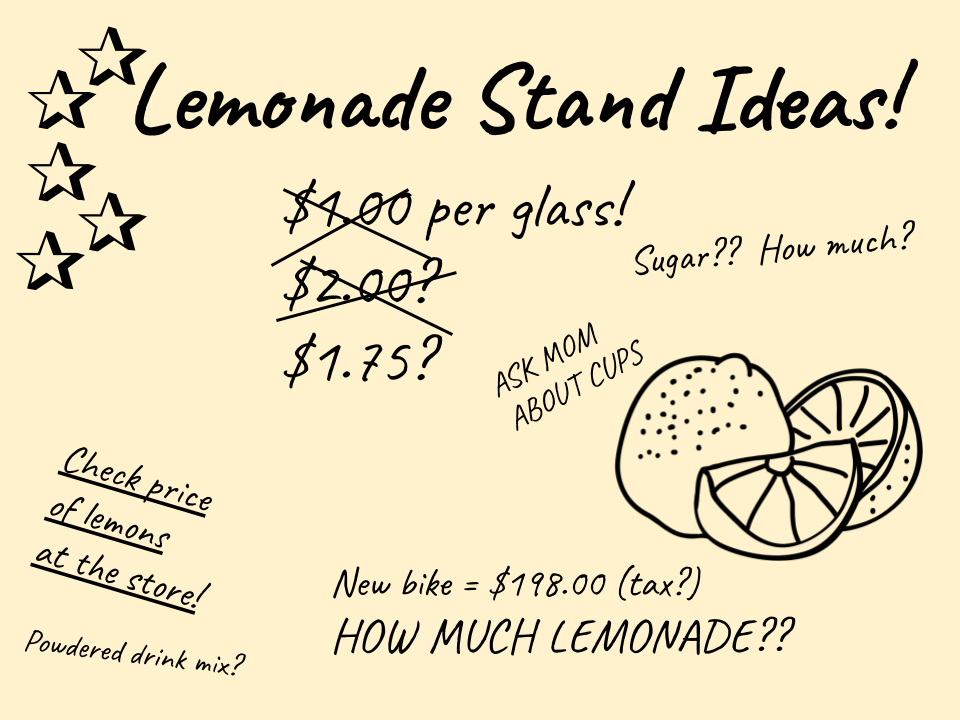 🖼Show image
Notice and Wonder Have students share everything they notice about the situations described above. Then, separately, have them share what they wonder. |
One example of a relationship we can find in this situation is that Sally takes in $1.75 for every glass she sells: revenue = $1.75 × glasses
What other relationships can you find here?
(Give students a chance to discuss and brainstorm)
-
Every glass sold brings in $1.75 in revenue
-
Every glass sold costs $0.30 in costs, such as lemonds, sugar and water
-
Every glass sold brings in some amount of profit: it costs a certain amount to make, but it brings in another amount in revenue
Investigate
Students form groups and brainstorm their ideas for functions. Students can use any strategies they’ve learned so far.
Strategies for English Language Learners MLR 7 - Compare and Connect There are several correct ways to write the functions needed for Sally’s Lemonade. Have students compare methods and develop understanding and language related to mathematical representation and methods. What are the advantages of the different solutions? What are some drawbacks? |
-
What is the difference between revenue and profit? Revenue is the total amount of money that comes in, profit is the remaining money after cost has been subtracted.
-
How could Sally increase her profits? By decreasing her costs, raising her prices (which increases revenue), by selling more lemonade.
-
What is the relationship between profit, cost, and revenue? Profit = Revenue - Cost
Students work with their partners to develop their function models for revenue (Page 33), cost (Page 34), and profit (Page 35), using the Design Recipe.
While students are working, walk the room and gauge student understanding. There is more than one correct way to write the profit function! Encourage discussion between students and push students to develop their thinking on the advantages and disadvantages of each correct solution.
Synthesis
This activity started with a situation, and students modeled that situation with functions. One part of the model was profit, which can be written several ways, for example:
fun profit(g): (1.75 * g) - (0.30 * g) end
fun profit(g): (1.75 - 0.30) * g end
fun profit(g): 1.45 * g end
fun profit(g): revenue(g) - cost(g) end-
Which way is "best", and why?
-
If lemons gets more expensive, which way requires the least amount of change?
-
If sugar gets less expensive, which way requires the least amount of change?
Big Ideas
-
profitcan be decomposed into a simple function that uses thecostandrevenuefunctions. -
Decomposing a problem allows us to solve it in smaller pieces, which are also easier to test!
-
These pieces can also be re-used, resulting in writing less code, and less duplicate code.
-
Duplicate code means more places to make mistakes, especially when that code needs to be changed.
Top-Down vs. Bottom-Up 20 minutes
Overview
Students explore problem decomposition as an explicit strategy, and learn about two ways of decomposing.
Launch
Top-Down and Bottom-Up design are two different strategies for problem decomposition.
Bottom-Up: start with the small, easy relationships first and then build our way to the larger relationships. In the Lemonade Stand, you defined cost and revenue first, and then put them together in profit.
Top-Down: start with the "big picture" and then worry about the details later. We could have started with profit, and made a to-do list of the smaller pieces we’d build later
Investigate
Consider the following situation:
Jamal’s trip requires him to drive 20mi to the airport, fly 9,000mi, and then take a bus 6mi to his hotel. His average speed driving to the airport is 40mph, the average speed of an airplane is 575mph, and the average speed of his bus is 15mph.
Aside from time waiting for the plane or bus, how long is Jamal in transit?
This can be decomposed via Top-Down or Bottom-Up design. What functions would you define to solve this, and in what order? For extra credit, you can actually compute the answer!
Synthesize
Make sure that students see both strategies, and have them discuss which they prefer and why.
These materials were developed partly through support of the National Science Foundation,
(awards 1042210, 1535276, 1648684, and 1738598).
Bootstrap:Integrated Oklahoma by Jen Poole
is licensed under a
Creative Commons 4.0 Unported License.
Based on a work at www.BootstrapWorld.org.
Permissions beyond the scope of this license may be available by contacting
schanzer@BootstrapWorld.org.
Introduction to Computational Data Science
Introduction to Computational Data Science
Students are introduced to the Animals Dataset, learn about Tables, Categorical and Quantitative data, and consider the kinds of questions that can be asked about a dataset.
Prerequisites |
None |
Relevant Standards |
Select one or more standards from the menu on the left (⌘-click on Mac, Ctrl-click elsewhere). CSTA Standards
K-12CS Standards
|
Lesson Goals |
Students will be able to…
|
Student-facing Lesson Goals |
|
Materials |
|
Preparation |
|
Supplemental Resources |
|
Language Table |
No language features in this lesson |
- categorical data
-
data whose values are qualities that are not subject to the laws of arithmetic.
- data science
-
the science of collecting, organizing, and drawing general conclusions from data, with the help of computers
- programming language
-
a set of rules for writing code that a computer can evaluate
- quantitative data
-
number values for which arithmetic makes sense
Introduction 20 minutes
Overview
Students look at opening questions, either at their desks or in a walk around the room. They select a question they are personally interested in, and think about the data required to answer that question. This process draws a direct line between answering questions they care about and the basics of data science.
Launch
-
Give students 2 minutes to choose a question that grabs their attention, and group themselves by question. Ideally, no student will be the only one interested in that question.
-
Have students spend 2 minutes coming up with a hypothesis about what the answer is, and explaining why. Does every student in a single question-grouping have the same answer?
Investigate
-
What information would you collect to answer this question? Give students 5 minutes to think about what information they would need to collect, to find the answer.
Possible Misconceptions
Students may lean towards questions about individuals, instead of questions about what’s true for a group of individuals who vary from one to another. For example, instead of wondering what movie gets the highest rating, they should ask what’s the typical rating for movies in a list, or how much those ratings tend to vary.
Synthesize
Have students share back the different data they would gather to answer their questions. For each question, students would likely have to gather many different kinds of data. If we wanted to find out if small schools are better than big schools, for example, we might want to gather data on SAT scores, college acceptance, etc. Each of these is a variable in our dataset: any two schools we look at could vary by each of them.
What’s the greatest movie of all time? Is Climate Change real? Who is the best quarterback? Is Stop-and-Frisk racially biased? We can’t survey every school in the world, get data on every movie ever made, or every police action - but we can do an analysis for a sample of them, and try to infer something about all of them as a whole. These questions quickly turn into a discussion about data — how you assess it, how you interpret the results, and what you can infer from those results. The process of learning from data is called Data Science. Data science techniques are used by scientists, business people, politicians, sports analysts, and hundreds of other different fields to ask and answer questions about data.
We’ll use a programming language to investigate these questions. Just like any human language, programming languages have their own vocabulary and grammar that you will need to learn. The language you’ll be learning for data science is called Pyret.
The Animals Dataset 25 minutes
Overview
Students explore the Animals Dataset, sharing observations and familiarizing themselves with the idiosyncrasies and patterns in the data. In the process, they learn about Categorical and Quantitative data.
Notice and Wonder Pedagogy This pedagogy has a rich grounding in literature, and is used throughout this course. In the "Notice" phase, students are asked to crowd-source their observations. No observation is too small or too silly! Students may notice that the animals table has corners, or that it’s printed in black ink. But by listening to other students' observations, students may find themselves taking a closer look at the dataset to begin with. The "Wonder" phase involves students raising questions, but they must also explain the context for those questions. Sharon Hessney (moderator for the NYTimes excellent What’s going on in this Graph? activity) sometimes calls this "what do you wonder…and why?". Both of these phases should be done in groups or as a whole class, with time given to each. |
Launch
Have students open the Animals Spreadsheet in a browser tab, or turn to The Animals Dataset (Page 37) in their Student Workbooks.
Investigate
This table contains data from an animal shelter, listing animals that have been adopted. We’ll be analyzing this table as an example throughout the course, but you’ll be applying what you learn to a dataset you choose as well.
-
Turn to Questions and Column Descriptions (Page 39) in your Student Workbook. What do you _Notice about this dataset? Write down your observations in the first column.
-
Sometimes, looking at data sparks questions. What do you Wonder about this dataset, and why? Write down your questions in the second column.
-
There’s a third column, called “Question Type” — we’re going to return to that later, so you can ignore it for now.
-
If you look at the bottom of the spreadsheet file, you’ll see that this document contains multiple sheets. One is called
"pets"and the other is called"README". Which sheet are we looking at? -
Each sheet contains a table. For our purposes, we only care about the animals table on the
"pets"sheet.
Any two animals in our dataset may have different ages, weights, etc. Each of these is called a variable in the dataset.
Data Scientists work with two broad kinds of data: Categorical Data and Quantitative Data. Categorical Data is used to classify, not measure. Categories aren’t subject to the laws of arithmetic. For example, we couldn’t ask if “cat is more than lizard”, and it doesn’t make sense to "find the average ZIP code” in a list of addresses. “Species” is a categorical variable, because we can ask questions like “which species does Mittens belong to?"
What are some other categorical variables you see in this table?
Quantitative Data is used to measure an amount of something, or to compare two pieces of data to see which is less or more. If we want to ask “how much” or “which is most”, we’re talking about Quantitative Data. "Pounds" is a quantitative variable, because we can talk about whether one animal weighs more than another or ask what the average weight of animals in the shelter is.
We use Categorical Data to answer “what kind?”, and Quantitative Data to answer "how much?".
-
Turn to page Categorical or Quantitative? (Page 38), and answer questions 1-7.
-
Sometimes it can be tricky to figure out if data is categorical or quantitative, because it depends on how that data is being used!
-
On Categorical or Quantitative? (Page 38) in your Student Workbook, fill in the blanks for questions 8-13.
Synthesize
Have students share back their noticings (statements) and wonderings (questions), and write them on the board.
Data Science is all about using a smaller sample of data to make predictions about a larger population. It’s important to remember that tables are only a sample of a larger population: this table describes some animals, but obviously it isn’t every animal in the world! Still, if we took the average age of the animals from this particular shelter, it might tell us something about the average age of animals from other shelters.
Question Types 10 minutes
Overview
Students begin to categorize questions, sorting them into "lookup", "compute", and "relate" questions - as well as questions that simply can’t be answered based on the data.
Launch
Once we have a dataset, we can start asking questions! But how do we know what questions to ask? There’s an art to asking the right questions, and good Data Scientists think hard about what kind of questions can and can’t be answered.
Most questions can be broken down into one of four categories:
-
Lookup questions — These can be answered simply by looking up a single value in the table and reading it out. Once you find the value, you’re done! Examples of lookup questions might be “is Sunflower fixed?” or “How many legs does Felix have?”
-
Compute questions — These can be answered by computing an answer across a single column. Examples of computing questions might be “how much does the heaviest animal weigh?” or “What is the average age of animals from the shelter?”
-
Relate questions — These ones take the most work, because they require looking for relationships between multiple columns. Examples of analysis questions might be “Do cats tend to be adopted faster than dogs?” or “Are older animals heavier than young ones?”
-
Can’t answer — These are questions that just can’t be answered based on the available data. We might ask "are cats or dogs better for elderly owners?", but the Animals Dataset doesn’t have information that we can use to answer it.
Investigate
-
Come up with examples for each type of question.
-
Look back at the Wonders you wrote on Questions and Column Descriptions (Page 39). Are any of these Lookup, Compute, or Relate questions? Circle the question type that’s appropriate. Can you come up with additional examples for each type of question?
Synthesize
Have students share their questions with the class. Allow time for discussion!
Have students reflect on what they learned by writing on What’s on your mind? (Page 40). Some prompts that may be helpful:
-
What new vocabulary did you learn?
-
What question was exciting to you, and what data would you need to answer it? Is that data Qualitative or Quantitative?
-
What do you hope to learn in the next lesson?
Additional Exercises:
These materials were developed partly through support of the National Science Foundation,
(awards 1042210, 1535276, 1648684, and 1738598).
Bootstrap:Integrated Oklahoma by Jen Poole
is licensed under a
Creative Commons 4.0 Unported License.
Based on a work at www.BootstrapWorld.org.
Permissions beyond the scope of this license may be available by contacting
schanzer@BootstrapWorld.org.
Starting to Program
Starting to Program
Students begin to program in Pyret, learning about basic datatypes, operations, and value definitions.
Prerequisites |
None |
Relevant Standards |
Select one or more standards from the menu on the left (⌘-click on Mac, Ctrl-click elsewhere). CSTA Standards
Oklahoma Standards
|
Lesson Goals |
Students will be able to…
|
Student-facing Lesson Goals |
|
Materials |
|
Preparation |
|
Supplemental Resources |
|
Language Table |
Students are not expected to have any familiarity with the Pyret programming for this lesson. |
- data row
-
a structured piece of data in a dataset that typically reports all the information gathered about a given individual
- definitions area
-
the left-most text box in the Editor where definitions for values and functions are written
- editor
-
software in which you can write and evaluate code
- header
-
the titles of each column of a table, usually shown at the top
- identifier column
-
a column of unique values which identify all the individual rows (e.g. - student IDs, SSNs, etc)
- interactions area
-
the right-most text box in the Editor, where expressions are entered to evaluate
Introducing Pyret 10 minutes
Overview
Students open up the Pyret environment (code.pyret.org, or "CPO") and see how tables look in Pyret.
Launch

Open up the Animals Starter File in a new tab. Click “Connect to Google Drive” to sign into your Google account. This will allow you to save Pyret files into your Google Drive. Next, click the "File" menu and select "Save a Copy". This will save a copy of the file into your own account, so that you can make changes and retrieve them later.
This screen is called the Editor, and it looks something like the diagram you see here. There are a few buttons at the top, but most of the screen is taken up by two large boxes: the Definitions Area on the left and the Interactions Area on the right.
The Definitions Area is where programmers define values and functions that they want to keep, while the Interactions Area allows them to experiment with those values and functions. This is like writing function definitions on a blackboard, and having students use those functions to compute answers on scrap paper.
For now, we will only be writing programs in the Interactions Area.
The first few lines in the Definitions Area tell Pyret to import files from elsewhere, which contain tools we’ll want to use for this course. We’re importing a file called Bootstrap:Data Science, as well as files for working with Google Sheets, tables, and images:
include shared-gdrive("Bootstrap-DataScience-...")
include gdrive-sheets
include tables
include image
After that, we see a line of code that defines shelter-sheet to be a spreadsheet. This table is loaded from Google Drive, so now Pyret can see the same spreadsheet you do. (Notice the funny scramble of letters and numbers in that line of code? If you open up the Google Sheet, you’ll find that same scramble in the address bar! That scramble is how the Pyret editor knows which spreadsheet to load.) After that, we see the following code:
# load the 'pets' sheet as a table called animals-table
animals-table = load-table: name, species, age, fixed, legs
  source: pets-sheet.sheet-by-name("pets", true)
end
The first line (starting with #) is called a Comment. Comments are notes for humans, which the computer ignores. The next line defines a new table called animals-table, which is loaded from the shelter-sheet defined above. We also create names for the columns: name, species, sex, age, fixed, legs, pounds and weeks. We could use any names we want for these columns, but it’s always a good idea to pick names that make sense!
Even if your spreadsheet already has column headers, Pyret requires that you name them in the program itself.
Click “Run”, and type animals-table into the Interactions Area to see what the table looks like in Pyret. Is it the same table you saw in Google Sheets? What is the same? What is different?
In Data Science, every table is composed of cells, which are arranged in a grid of rows and columns. Most of the cells contain data, but the first row and first column are special. The first row is called the header row, which gives a unique name to each variable (or “column”) in the table. The first column in the table is the identifier column, which contains a unique ID for each row. Often, this will be the name of each individual in the table, or sometimes just an ID number.
Below is an example of a table with one header row and two data rows:
| name | species | sex | age | fixed | legs | pounds | weeks |
|---|---|---|---|---|---|---|---|
"Sasha" |
"cat" |
"female" |
1 |
false |
4 |
6.5 |
3 |
"Mittens" |
"cat" |
"female" |
2 |
true |
4 |
7.4 |
1 |
Investigate
-
How many variables are listed in the header row for the Animals Dataset? What are they called? What is being used for the identifier column in this dataset?
-
Try changing the name of one of the columns, and click "Run". What happens when you print out the table back in the Interactions Area?
-
What happens if you remove a column from the list? Or add an extra one?
After the header, Pyret tables can have any number of data rows. Each data row has values for every column variable (nothing can be left empty!). A table can have any number of data rows, including zero, as in the table below:
| name | species | sex | age | fixed | legs | pounds | weeks |
|---|
Numbers, Strings and Booleans 25 minutes
Overview
This lesson starts them programming, showing students how to make Pyret do simple math, work with text, and create simple computer graphics. It also draws attention to error messages, which are helpful when diagnosing mistakes.
Launch
Pyret lets us use many different kinds of data. In the animals table, for example, there are Numbers (the number of legs each animal has), Strings (the species of the animal), and Booleans (whether it is true or false that an animal is fixed). Pyret has the usual arithmetic operators: addition (+), subtraction (-), multiplication (*), and division (/).
To identify if an animal is male, we need to know if the value in the sex column is equal to the string "male". To sort the table by age, we need to know if one animal’s age is less than another’s and should come before it. To filter the table to show only young animals, we might want to know if an animal’s age is less than 2. Pyret has Boolean operators, too: equals (==), less-than (<), greater-than (>), as well as greater-than-or-equal (>=) and less-than-or-equal (<=).
Investigate
In pairs, students complete Numbers and Strings (Page 42).
Discuss what students have learned about Pyret:
-
Numbers and Strings evaluate to themselves.
-
Anything in quotes is a String, even something like
"42". -
Strings must have quotation marks on both sides.
-
Operators like
+,-,*, and/need spaces around them. -
Any time there is more than one operator being used, Pyret requires that you use parentheses.
-
Types matter! We can add two Numbers or two Strings to one another, but we can’t add the Number
4to the String"hello".
Error messages are a way for Pyret to explain what went wrong, and are a really helpful way of finding mistakes. Emphasize how useful they can be, and why students should read those messages out loud before asking for help. Have students see the following errors:
-
6 / 0. In this case, Pyret obeys the same rules as humans, and gives an error. -
A`(2 + 2`. An unclosed quotation mark is a problem, and so is an unmatched parentheses.
In pairs, students complete Booleans (Page 43).
Synthesize
Debrief student answers as a class.
Going Deeper By using the |
Defining Values 20 minutes
Overview
Students learn how to define values in Pyret (note that these definitions work the way variable substitution does in math, as opposed to variable assignment you may have seen in other programming languages).
Launch
Pyret allows us to define names for values using the = sign. In math, you’re probably used to seeing definitions like x = 4, which defines the name x to be the value 4. Pyret works the same way, and you’ve already seen two names defined in this file: shelter-sheet and animals-table. We generally write definitions on the left, in the Definitions Area. You can add your own definitions, for example:
my-name = "Maya"
sum = 2 + 2
kittens-are-cute = true
With your partner, take turns adding definitions to this file:
-
Define a value with name
food, whose value is a String representing your favorite food -
Define a value with name
year, whose value is a Number representing the current year -
Define a value with name
likes-cats, whose value is a Boolean that istrueif you like cats andfalseif you don’t
Synthesize
Why is it useful to be able to define values, and refer to them by name?
Additional Exercises:
These materials were developed partly through support of the National Science Foundation,
(awards 1042210, 1535276, 1648684, and 1738598).
Bootstrap:Integrated Oklahoma by Jen Poole
is licensed under a
Creative Commons 4.0 Unported License.
Based on a work at www.BootstrapWorld.org.
Permissions beyond the scope of this license may be available by contacting
schanzer@BootstrapWorld.org.
Defining Functions
Defining Functions
Students learn a structured approach to problem solving called the “Design Recipe”. They then use these functions to create images, and learn how to apply them to enhance their scatterplots.
Prerequisites |
|||||||||||||||||||
Relevant Standards |
Select one or more standards from the menu on the left (⌘-click on Mac, Ctrl-click elsewhere). CSTA Standards
K-12CS Standards
Next-Gen Science Standards
Oklahoma Standards
|
||||||||||||||||||
Lesson Goals |
Students will be able to…
|
||||||||||||||||||
Student-facing Lesson Goals |
|
||||||||||||||||||
Materials |
|||||||||||||||||||
Preparation |
|
||||||||||||||||||
Supplemental Resources |
In a more programming-focused course, or if appropriate for your learning goals, students learn to write more sophisticated functions by learning about conditionals in the If-Expressions lesson. |
||||||||||||||||||
Language Table |
|
- design recipe
-
a sequence of steps that helps people document, test, and write functions
Defining Functions over Numbers 20 minutes
Overview
Students have learned to define values (e.g. - name = "Maya", x = 5, etc). Students should have defined animalA and animalB to be the following two rows in the animals table.
animalA = animals-table.row-n(4)
animalB = animals-table.row-n(13)
If they haven’t, make sure they do this now.
Launch
Suppose we want to make a solid, green triangle of size 10. What would we type? What if we wanted to make one of size 20? 25? 1000?
triangle(10, "solid", "green")
triangle(20, "solid", "green")
triangle(25, "solid", "green")
triangle(1000, "solid", "green")
This is a lot of redundant typing, when the only thing changing is the size of the triangle! It would be convenient to define a shortcut, which only needs the size. Suppose we call it gt for short:
gt(10)
gt(20)
gt(25)
gt(1000)
We don’t need to tell gt whether the shape is "solid" or "outline", and we don’t need to tell it what color to use. We will define our shortcut so it already knows these things, and all it needs is the size. This is a lot like defining values, which we already know how to do. But values don’t change, so our triangles would always be the same size. Instead of defining values, we need to define functions.
To build our own functions, we’ll use a series of steps called the Design Recipe. The Design Recipe is a way to think through the behavior of a function, to make sure we don’t make any mistakes with the animals that depend on us! The Design Recipe has three steps, and we’ll go through them together for our first function.
Turn to The Design Recipe (Page 45) in your Student Workbook, and read the word problem at the top of the page.
Step 1: Contract and Purpose
The first thing we do is write a Contract for this function. You already know a lot about contracts: they tell us the Name, Domain and Range of the function. Our function is named gt, and it consumes a Number. It makes triangles, so the output will be an Image. A Purpose Statement is just a description of what the function does:
# gt :: (size :: Number) -> Image
# Consumes a size, and produces a solid green triangle of that size.
Since the contract and purpose statement are notes for humans, we add the # symbol at the front of the line to turn them into comments.
Be sure to check students’ contracts and purpose statements before having them move on!
Step 2: Write Examples
Examples are a way for us to tell the computer how our function should behave for a specific input. We can write as many examples as we want, but they must all be wrapped in an examples: block and an end statement. Examples start with the name of the function we’re writing, followed by an example input. Suppose we write gt(10). What work do we have to do, in order to produce the right shape as a result? What if we write gt(20)?
# gt :: (size :: Number) -> Image
# Consumes a size, and produces a solid green triangle of that size.
examples:
  gt(100) is triangle(100, "solid", "green")
  gt(30) is triangle(30, "solid", "green")
end
Step 3: Define the Function
We start with the fun keyword (short for “function”), followed by the name of our function and a set of parentheses. This is exactly how all of our examples started, too. But instead of writing 10 or 20, we’ll use the label from our Domain. Then we add a colon (:) in place of is, and write out the work we did to get the answers for our examples. Finally, we finish with the end keyword.
# gt :: (size :: Number) -> Image
# Consumes a size, and produces a solid green triangle of that size.
examples:
  gt(100) is triangle(100, "solid", "green")
  gt(30) is triangle(30, "solid", "green")
end
fun gt(size):
  triangle(size, "solid", "green")
end
Investigate
Type your function definition into the Definitions Area. Be sure to include the Contract, Purpose Statement, Examples and your Definition! Once you have typed everything in, click "Run" and evaluate gt(10) in the Interactions Area. What did you get back?
Once we have defined a function, we can use it as our shortcut! This makes it easy to write simpler code, by moving the complexity into a function that can be tested and re-used whenever we like.
-
Use the Design Recipe to solve the word problem at the bottom of The Design Recipe (Page 45).
-
Type in the Contract, Purpose Statement, Examples and Definition into the Definitions Area.
-
Click “Run”, and make sure all your examples pass!
-
Type bc(20) into the Interactions Area. What happens?
Synthesize
Ask students what happens if they change one of the examples to be incorrect: gt(10) is triangle(99, "solid", "green")
Defining Functions over Other Datatypes 20 minutes
Overview
Students deepen their understanding of function definition and the Design Recipe, by solving different kinds of problems.
Launch
Functions can consume values besides Numbers. For example, we might want to define a function called sticker that consumes a Color, and draws a star of that color:
sticker("blue") is star(50, "solid", "blue")
sticker("yellow") is star(50, "solid", "yellow")
Or a function called nametag that consumes a Row from the animals table, and draws that animal’s name in purple letters.
nametag(animalA) is text(animalA["name"], 10, "purple")
nametag(animalB) is text(animalB["name"], 10, "purple")
Investigate
Turn to The Design Recipe (Page 46), and use the Design Recipe to write both of these functions.
Custom Scatter Plot Images 15 minutes
Overview
Students discover functions that consume other functions, and compose a scatter plot function with one of the functions they’ve already defined.
Launch
Students have used Pyret functions that use Numbers, Strings, Images, and even Tables and Rows. Now they’ve written functions of their own that work with these datatypes. However, Pyret functions can even use other functions! Have students look at the Contract for image-scatter-plot:
image-scatter-plot :: (t :: Table, xs :: String, ys :: String, f :: (Row -> Image)) -> Image
This function looks a lot like the regular scatter-plot function. It takes in a table, and the names of columns to use for x- and y-values. Take a closer look at the third input…
...f :: (Row -> Image)...
That looks like the contract for a function! Indeed, the third input to image-scatter-plot is named f, which itself is a function that consumes Rows and produces Images. In fact, students have just defined a function that does exactly that!
Investigate
-
Type
image-scatter-plot(animals-table, "pounds", "weeks", nametag)into the Interactions Area. -
What did you get?
-
What other scatter plots could we create?
Note: the optional lesson If Expressions goes deeper into basic programming constructs, using image-scatter-plot to motivate more complex (and exciting!) plots.
Synthesize
Functions are powerful tools, for both mathematics and programming. They allow us to create reusable chunks of logic that can be tested to ensure correctness, and can be used over and over to solve different kinds of problems. A little later on, you’ll learn how to combine, or compose functions together, in order to handle more complex problems.
Additional Exercises:
These materials were developed partly through support of the National Science Foundation,
(awards 1042210, 1535276, 1648684, and 1738598).
Bootstrap:Integrated Oklahoma by Jen Poole
is licensed under a
Creative Commons 4.0 Unported License.
Based on a work at www.BootstrapWorld.org.
Permissions beyond the scope of this license may be available by contacting
schanzer@BootstrapWorld.org.
Applying Functions
Applying Functions
Students learn how to apply Functions, and how to interpret the information contained in a Contract: Name, Domain and Range. They then use this knowledge to explore more of the Pyret language.
Prerequisites |
|
Relevant Standards |
Select one or more standards from the menu on the left (⌘-click on Mac, Ctrl-click elsewhere). Oklahoma Standards
|
Lesson Goals |
Students will be able to…
|
Student-facing Lesson Goals |
|
Materials |
|
Preparation |
|
Supplemental Resources |
|
Language Table |
No language features in this lesson |
- arguments
-
the inputs to a function; expressions for arguments follow the name of a function
- contract
-
a statement of the name, domain, and range of a function
- domain
-
the type or set of inputs that a function expects
- function
-
a mathematical object that consumes inputs and produces an output
- range
-
the type or set of outputs that a function produces
Applying Functions 15 minutes
Overview
Students learn how to apply functions in Pyret, reinforcing concepts from standard Algebra.
Launch
Students know about Numbers, Strings, Booleans and Operators — all of which behave just like they do in math. But what about functions? They may remember functions from algebra: fx = x².
-
What is the name of this function?
-
The expression f2 applies the function f to the number 2. What will it evaluate to?
-
What will the expression f3 evaluate to?
-
The values to which we apply a function are called its arguments. How many arguments does f expect?
Arguments (or "inputs") are the values passed into a function. This is different from variables, which are the placeholders that get replaced with input values! Pyret has lots of built-in functions, which we can use to write more interesting programs.
Have students log into CPO and open the "Animals Starter File". If they don’t have the file, they can open a new one. Have students type this line of code into the interactions area and hit Enter: num-sqrt(16).
-
What is the name of this function?
-
What do we think the expression
num-sqrt(16)will evaluate to? -
What did the expression
num-sqrt(16)evaluate to? -
Does the
num-sqrtfunction produce Numbers? Strings? Booleans? -
How many arguments does
num-sqrtexpect?
Have students type this line of code into the interactions area and hit Enter: num-min(140, 84).
-
What is the name of this function?
-
What does the expression
num-min(140, 84)evaluate to? -
Does the
num-minfunction produce Numbers? Strings? Booleans? -
How many arguments does
num-minexpect? -
What happens if we forget to include a comma between our numbers?
Just like in math, functions can also be composed with one another. For example:
# take the minimum of 84 and 99, then take the square root of the result
num-sqrt(num-min(84, 99))
Investigation
Have students complete Applying Functions (Page 48).
Synthesize
Debrief the activity with the class. What kind of value was produced by that expression? (An Image! New datatype!) Which error messages were helpful? Which ones weren’t?
Contracts 35 minutes
Overview
Students learn about Contracts, and how they can be used to figure out new functions or diagnose errors in their code. Then they use this knowledge to explore the contracts pages in their workbooks.
Launch
When students typed triangle(50, "solid", "red"), they created an example of a new Datatype, called an Image.
-
What are the types of the arguments
trianglewas expecting? -
How does this output relate to the inputs?
-
Try making different triangles. Change the size and color! Try using
"outline"for the second argument.
The triangle function consumes a Number and two Strings as input, and produces an Image. As you can imagine, there are many other functions for making images, each with a different set of arguments. For each of these functions, we need to keep track of
three things:
-
Name — the name of the function, which we type in whenever we want to use it
-
Domain — the type of data we give to the function (names and Types!), written between parentheses and separated by commas
-
Range — the type of data the function produces
Domain and Range are Types, not specific values. As a convention, we capitalize Types and keep names in lowercase. triangle works on many different Numbers, not just the 20 we used in the example above!
These three parts make up a contract for each function. Let’s take a look at the Name, Domain, and Range of the functions we’ve seen before:
# num-sqrt :: (n :: Number) -> Number
# num-min :: (a :: Number, b :: Number) -> Boolean
# triangle :: (side :: Number, mode :: String, color :: String) -> Image
The first part of a contract is the function’s name. In this example, our functions are named num-sqrt, and triangle.
The second part is the Domain, or the names and types of arguments the function expects. triangle has a Number and two Strings as variables, representing the length of each side, the mode, and the color. We write name-type pairs with double-colons, with commas between each one. Finally, after the arrow goes the type of the Range, or the function’s output, which in this case is Image.
Contracts tell us a lot about how to use a function. In fact, we can figure out how to use functions we’ve never seen before, just by looking at the contract! Most of the time, error messages occur when we’ve accidentally broken a contract.
Investigate
Turn to the back of your workbook, and get some practice reading and using Contracts! Make sure you try out the following functions:
-
text -
circle -
ellipse -
star -
string-repeat
When you’ve figured out the code for each of these, write it down in the empty line beneath each contract. These pages will become your reference for the remainder of the class!
Here’s an example of another function. Type it into the Interactions Area to see what it does. Can you figure out the contract, based on the example?
string-contains("apples, pears, milk", "pears")
Possible Misconceptions
Students are very likely to randomly experiment, rather than actually using the Contracts page. You should plan to ask lots of direct questions to make sure students are making this connection, such as:
-
How many items are in this function’s Domain?
-
What is the name of the 1st item in this function’s Domain?
-
What is the type of the 1st item in this function’s Domain?
-
What is the type of the Range?
Synthesize
You’ve learned about Numbers, Strings, Booleans, and Images. You’ve learned about operators and functions, and how they can be used to make shapes, strings, and more!
One of the other skills you’ll learn in this class is how to diagnose and fix errors. Some of these errors will be syntax errors: a missing comma, an unclosed string, etc. All the other errors are contract errors. If you see an error and you know the syntax is right, ask yourself these two questions:
-
What is the function that is generating that error?
-
What is the contract for that function?
-
Is the function getting what it needs, according to its Domain?
By learning to use values, operations and functions, you are now familiar with the fundamental concepts needed to write simple programs. You will have many opportunities to use these concepts in this course, by writing programs to answer data science questions.
Make sure to save your work, so you can go back to it later!
Additional Exercises:
These materials were developed partly through support of the National Science Foundation,
(awards 1042210, 1535276, 1648684, and 1738598).
Bootstrap:Integrated Oklahoma by Jen Poole
is licensed under a
Creative Commons 4.0 Unported License.
Based on a work at www.BootstrapWorld.org.
Permissions beyond the scope of this license may be available by contacting
schanzer@BootstrapWorld.org.
Displaying Categorical Data
Displaying Categorical Data
Students learn to apply functions to entire Tables, generating pie charts and bar charts. They then explore other plotting and display functions that are part of the Data Science library.
Prerequisites |
||||||||||||||||
Relevant Standards |
Select one or more standards from the menu on the left (⌘-click on Mac, Ctrl-click elsewhere). CSTA Standards
K-12CS Standards
Oklahoma Standards
|
|||||||||||||||
Lesson Goals |
Students will be able to:
|
|||||||||||||||
Student-facing Lesson Goals |
|
|||||||||||||||
Materials |
||||||||||||||||
Preparation |
|
|||||||||||||||
Supplemental Resources |
||||||||||||||||
Language Table |
|
- bar chart
-
a display of categorical data that uses bars positioned over category values; each bar’s height reflects the count or percentage of data values in that category
- contract
-
a statement of the name, domain, and range of a function
- domain
-
the type or set of inputs that a function expects
- pie chart
-
a display that uses areas of a circular pie’s slices to show percentages in each category
Displaying Categorical Variables 10 minutes
Overview
Students extend their understanding of Contracts and function application, learning new functions that consume Tables and produce displays and plots.
Launch
Have students ever seen any pictures created from tables of data? Can they think of a situation when they’d want to consume a Table, and use that to produce an image? The library included at the top of the file includes some helper functions that are useful for Data Science, which we will use throughout this course. Here is the Contract for a function that makes pie charts, and an example of using it:
# pie-chart :: (t :: Table, col :: String) -> Image
pie-chart(animals-table, "legs")
-
What is the Name of this function?
-
How many inputs are in its Domain?
-
In the Interactions Area, type
pie-chart(animals-table, "legs")and hit Enter. What happens?
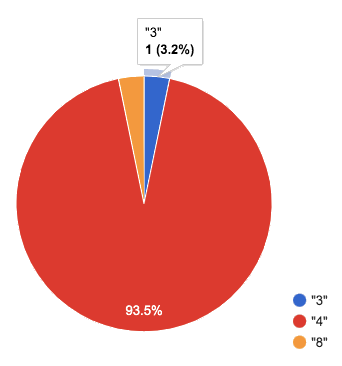
Hovering over a pie slice reveals the label, as well as the count and the percentage of the whole. In this example we see that there is one three-legged animal, representing 3.2% of the population.
We can also resize the window by dragging its borders. This allows us to experiment with the data before closing the window and generating the final, non-interactive image.
The function pie-chart consumes a Table of data, along with the name of a categorical column you want to display. The computer goes through the column, counting the number of times that each value appears. Then it draws a pie slice for each value, with the size of the slice being the percentage of times it appears. In this example, we used our animals-table table as our dataset, and made a pie chart showing the distribution of legs across the shelter.
Investigate
Here is the Contract for another function, which makes bar charts:
# bar-chart :: (t :: Table, col :: String) -> Image
-
Which column of the animals table tells us how many legs an animal has?
-
Use
bar-chartto make a display showing how many animals have each number of legs. -
Experiment with pie and bar charts, passing in different column names. If you get an error message, read it carefully!
-
What do you think are the rules for what kinds of columns can be used by bar-chart and pie-chart?
-
When would you want to use one chart instead of another?
Possible Misconceptions
Pie charts and bar charts may show counts or percentages (in Pyret, pie charts show percentages and bar charts show counts). Bar charts look a lot like histograms, which are actually quite different because they display quantitative data, not categorical. Also, a pie chart can only display one categorical variable but a bar chart might be used to display two or more categorical variables.
Synthesize
Pie and Bar Charts display what portion of a sample that belongs to each category. If they are based on sample data from a larger population, we use them to infer the proportion of a whole population that might belong to each category.
Pie charts and bar charts are mostly used to display categorical columns.
While bars in some bar charts should follow some logical order (alphabetical, small-medium-large, etc), the pie slices and bars can technically be placed in any order, without changing the meaning of the chart.
Exploring other Displays 30 minutes
Overview
Students freely explore the Data Science display library. In doing so, they experiment with new charts, practice reading Contracts and error messages, and develop better intuition for the programming constructs they’ve seen before.
Launch
There are lots of other functions, for all different kinds of charts and plots. Even if you don’t know what these plots are for yet, see if you can use your knowledge of Contracts to figure out how to use them.
Investigate
Possible Misconceptions
There are many possible misconceptions about displays that students may encounter here. But that’s ok! Understanding all those other plots is not a learning goal for this lesson. Rather, the goal is to have them develop some loose familiarity, and to get more practice reading Contracts.
Synthesize
Today you’ve added more functions to your toolbox. Functions like pie-chart and bar-chart can be used to visually display data, and even transform entire tables!
You will have many opportunities to use these concepts in this course, by writing programs to answer data science questions.
Extension Activity Sometimes we want to summarize a categorical column in a Table, rather than a pie chart. For example, it might be handy to have a table that has a row for dogs, cats, lizards, and rabbits, and then the count of how many of each type there are. Pyret has a function that does exactly this! Try typing this code into the Interactions Area: What did we get back? - Use the - Use the Sometimes the dataset we have is already summarized in a table like this, and we want to make a chart from that. In this situation, we want to base our display on the summary table: the size of the pie slice or bar is taken directly from the count column, and the label is taken directly from the value column. When we want to use summarized data to produce a pie chart, we have another function:
|
Additional Exercises:
These materials were developed partly through support of the National Science Foundation,
(awards 1042210, 1535276, 1648684, and 1738598).
Bootstrap:Integrated Oklahoma by Jen Poole
is licensed under a
Creative Commons 4.0 Unported License.
Based on a work at www.BootstrapWorld.org.
Permissions beyond the scope of this license may be available by contacting
schanzer@BootstrapWorld.org.
Data Displays and Lookups
Data Displays and Lookups
Students continue to practice making different kinds of data displays, this time focusing less on programming and more on using displays to answer questions. They also learn how to extract individual rows from a table, and columns from a row.
Prerequisites |
|||||||||||||||||||
Relevant Standards |
Select one or more standards from the menu on the left (⌘-click on Mac, Ctrl-click elsewhere). CSTA Standards
K-12CS Standards
Next-Gen Science Standards
Oklahoma Standards
|
||||||||||||||||||
Lesson Goals |
Students will be able to…
|
||||||||||||||||||
Student-facing Lesson Goals |
|
||||||||||||||||||
Materials |
|||||||||||||||||||
Preparation |
|
||||||||||||||||||
Supplemental Resources |
|||||||||||||||||||
Language Table |
|
- categorical data
-
data whose values are qualities that are not subject to the laws of arithmetic.
- contract
-
a statement of the name, domain, and range of a function
- method
-
a function that is only associated with an instance of a datatype, which consumes inputs and produces an output based on that instance
- quantitative data
-
number values for which arithmetic makes sense
Displaying Data 20 minutes
Overview
Students get some more practice applying the plotting functions and working with Contracts, and begin to shift the focus from programming to data visualization. This activity stresses a hard programming skill (reading Contracts) with formal reading comprehension (identifying key portions of the sentence).
Launch
The Contracts page in the back of students' workbooks contains contracts for many plotting functions.
Suppose we wanted to generate a display showing the ratio of fixed to un-fixed animals from the shelter? How do we go from a simple sentence to working code that makes a data display?
To make a data display, we ask "Which Rows?", "Which Column(s)?", and "What Display?"
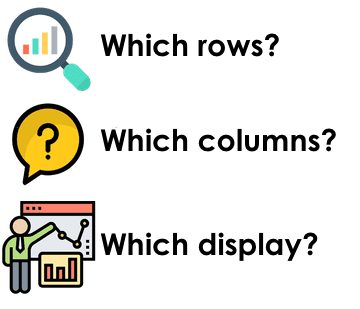
-
We start by asking which rows we’re talking about. In this case, it’s all the animals from the shelter.
-
We also need to know which column(s) - or "which variable(s)" - we are displaying. In this case, it’s the
fixedcolumn. -
Finally, we need to know which display we are using. Is it a histogram? Bar chart? Scatter plots are essential for displaying relationships between columns, but the other displays only deal with one column. Some displays work for categorical data, and others are for quantitative data.
Once we can answer these questions, all we need to do is find the Contract for that display and fill in the Domain!
To display the categorical data, we can choose between pie and bar charts. Which one of these two is best, and why?
Investigate
Do you know what kind of data is used for each display?
Turn to What Display Goes with Which Data? (Page 57), and see if you identify what kind of data each display needs!
Let’s get some practice going from questions to code, making visualizations.
Turn to Data Displays (Page 58), and see if you can fill in these three parts for a number of data display requests. When you’re finished, try to make the display in Pyret using the appropriate function.
Synthesize
Debrief the activity with students.
Optional: As an extension, have students break into teams and come up with additional Data Display challenges, then race to see which team can complete the other team’s challenges first!
Row and Column Lookups 30 minutes
Overview
Students learn how to access individual rows from a table in Pyret, and how to access a particular column from those rows.
Launch
Have students open their saved Animals Starter File (or make a new copy), and click “Run”.
Tables have special functions associated with them, called Methods, which allow us to do all sorts of things with those tables. For example, we can get the first data row in a table by using the .row-n method: animals-table.row-n(0)
Don’t forget: data rows start at index zero!
For practice, in the Interactions Area, use the row-n method to get the second and third data rows.
What is the Domain of .row-n? What is the Range? Find the contract for this method in your contracts table. A table method is a special kind of function which always operates on a specific table. In our example, we always use .row-n with the animals table, so the number we pass in is always used to grab a particular row from animals-table.
Pyret also has a way for us to get at individual columns of a Row, by using a Row Accessor. Row accessors start with a Row value, followed by square brackets and the name of the column where the value can be found. Here are three examples that use row accessors to get at different columns from the first row in the animals-table:
animals-table.row-n(0)["name"]
animals-table.row-n(0)["age"]
animals-table.row-n(0)["fixed"]
Investigate
-
How would you get the
weekscolumn out of the second row? The third? -
Complete the exercises on Lookup Questions (Page 59).
We can use the row-n method to define entire animal rows as values. Type the following lines of code into the Definitions Area and click “Run”:
animalA = animals-table.row-n(4)
animalB = animals-table.row-n(13)
Flip back to page 2 of your workbook and look at The Animals Dataset. Which row is animalA? Label it in the margin next to the dataset. Which row is animalB? Label it in the margin next to the dataset.
Now turn back to your screen.
What happens when you evaluate animalA in the Interactions Area?
-
Define at least two additional values to be animals from the
animals-table, calledanimalCandanimalD.
Synthesize
Have students share their answers, and see if there are any common questions that arise.
Additional Exercises:
These materials were developed partly through support of the National Science Foundation,
(awards 1042210, 1535276, 1648684, and 1738598).
Bootstrap:Integrated Oklahoma by Jen Poole
is licensed under a
Creative Commons 4.0 Unported License.
Based on a work at www.BootstrapWorld.org.
Permissions beyond the scope of this license may be available by contacting
schanzer@BootstrapWorld.org.
Table Methods
Table Methods
Students learn about table methods, which allow them to order, filter, and build columns to extend the animals table.
Prerequisites |
||||||||||||||||
Relevant Standards |
Select one or more standards from the menu on the left (⌘-click on Mac, Ctrl-click elsewhere). CSTA Standards
Next-Gen Science Standards
Oklahoma Standards
|
|||||||||||||||
Lesson Goals |
Students will be able to…
|
|||||||||||||||
Student-facing Lesson Goals |
|
|||||||||||||||
Materials |
||||||||||||||||
Preparation |
|
|||||||||||||||
Supplemental Resources |
||||||||||||||||
Language Table |
|
Review Function Definitions 15 minutes
Overview
Students get some practice reading function definitions, and in the process they build knowledge that’s needed later on in the lesson.
Launch
Let’s see how much you remember about function definitions! Load the Table Methods Starter File, go to the File menu, and click "Save a Copy".
Investigate
Students complete Reading Function Definitions (Page 62) in their student workbooks.
Synthesize
Can students explain what each function does?
Ordering Tables 10 minutes
Overview
Students learn a second table method, which allows them to sort rows in ascending or descending order, according to one column.
Launch
Have students find the contract for .order-by in their contracts pages. The .order-by method consumes a String (the name of the column by which we want to order) and a Boolean (true for ascending, false for descending). But what does it produce?
Investigate
-
Type
animals-table.order-by("name", true)into the Interactions Area. What do you get? -
Type
animals-table.order-by("age", false)into the Interactions Area. What do you get? -
Sort the animals table from heaviest-to-lightest.
-
Sort the animals table alphabetically by species.
-
Sort the animals table by how long it took for each animal to be adopted, in ascending order.
Synthesize
Answer any questions students may have. Class discussion: what do .order-by and .row-n have in common? How are they different?
Filtering Tables 20 minutes
Overview
Students learn how to filter tables, by removing rows.
Launch
Explain to students that you have "Function Cards", which describe the purpose statement of a function that consumes a Row from a table of students, and produces a Boolean (e.g. - "this student is wearing glasses"). Select a volunteer to be the "filter method", and have them randomly choose a Function Card, and make sure they read it without showing it to anyone else.
Have ~10 students line up in front of the classroom, and have the filter method go to each student and say "stay" or "sit" depending on whether their function would return true or false for that student. If they say "sit", the student sits down. If they say true, the student stays standing.
Ask the class: based on who sat and who stayed, what function was on the card?
The .filter method takes a function, and produces a new table containing only rows for which the function returns true.
Suppose we want to get a table of only animals that have been fixed? Have students find the contract for .filter in their contracts pages. The .filter method is taking in a function. What is the contract for that function? Where have we seen functions-taking-functions before?
Investigate
-
In the Interactions Area, type
animals-table.filter(is-fixed). What did you get? -
What do you expect
animals-tableto produce, and why? Try it out. What happened? -
In the Interactions Area, type
animals-table.filter(is-old). What did you get? -
In the Interactions Area, type
animals-table.filter(is-dog). What did you get? -
In the Interactions Area, type
animals-table.filter(lookup-name). What did you get?
The .filter method walks through the table, applying whatever function it was given to each row, and producing a new table containing all the rows for which the function returned true. Notice that the Domain for .filter says that test must be a function (that’s the arrow), which consumes a Row and produces a Boolean. If it consumes anything besides a single Row, or if it produces anything else besides a Boolean, we’ll get an error.
Possible Misconceptions
Students often think that filtering a table changes the table. In Pyret, all table methods produce a brand new table. If we want to save that table, we need to define it. For example: cats = animals-table.filter(is-cat).
Synthesize
Debrief with students. Some guiding questions on filtering:
-
Suppose we wanted to determine whether cats or dogs get adopted faster. How might using the
.filtermethod help? -
If the shelter is purchasing food for older cats, what filter would we write to determine how many cats to buy for?
-
Can you think of a situation where filtering fixed animals would be helpful?
Building Columns 10 minutes
Overview
Students learn how to build columns, using the .build-column table method.
Launch
Suppose we want to transform our table, converting pounds to kilograms or weeks to days. Or perhaps we want to add a "cute" column that just identifies the puppies and kittens? Have students find the contract for .build-column in their contracts pages. The .build-column method is taking in a function and a string. What is the contract for that function?
Investigate
-
Try typing
animals-table.build-column("old", is-old)into the Interactions Area. -
Try typing
animals-table.build-column("sticker", label)into the Interactions Area. -
What do you get? What do you think is going on?
The .build-column method walks through the table, applying whatever function it was given to each row. Whatever the function produces for that row becomes the value of our new column, which is named based on the string it was given. In the first example, we gave it the is-old function, so the new table had an extra Boolean column for every animal, indicating whether or not it was young. Notice that the Domain for .build-column says that the builder must be a function which consumes a Row and produces some other value. If it consumes anything besides a single Row, we’ll get an error.
Synthesize
Debrief with students. Ask them if they think of a situation where they would want to use this. Some ideas:
-
A dataset about school might include columns for how many students are in the school and how many pass the state exam. But when comparing schools of different sizes, what we really want is a column showing what percentage passed the exam. We could use
.build-columnto compute that for every row in the table. -
The animals shelter might want to print nametags for every animal. They could build a column using the
textfunction to have every animal’s name in big, purple letters. -
A dataset from Europe might list everything in metric (centimeters, kilograms, etc), so we could build a column to convert that to imperial units (inches, pounds, etc).
Additional Exercises:
These materials were developed partly through support of the National Science Foundation,
(awards 1042210, 1535276, 1648684, and 1738598).
Bootstrap:Integrated Oklahoma by Jen Poole
is licensed under a
Creative Commons 4.0 Unported License.
Based on a work at www.BootstrapWorld.org.
Permissions beyond the scope of this license may be available by contacting
schanzer@BootstrapWorld.org.
Defining Table Functions
Defining Table Functions
Students continue practicing the Design Recipe, writing helper functions to filter rows and build columns in the Animals Dataset, using Methods.
Prerequisites |
|||||||||||||||||||
Relevant Standards |
Select one or more standards from the menu on the left (⌘-click on Mac, Ctrl-click elsewhere). CSTA Standards
K-12CS Standards
Next-Gen Science Standards
Oklahoma Standards
|
||||||||||||||||||
Lesson Goals |
Students will be able to…
|
||||||||||||||||||
Student-facing Lesson Goals |
|
||||||||||||||||||
Materials |
|||||||||||||||||||
Preparation |
|
||||||||||||||||||
Language Table |
|
Defining Lookup Functions 25 minutes
Overview
Students continue practicing the Design Recipe, by writing functions to answer Lookup Questions.
Launch
Take two minutes to find all the fixed animals by hand. Turn to The Animals Dataset, and walk down the table one row at a time, putting a check next to each animal that is fixed.
To do this activity, what kind of question were you asking of each animal? Was it a Lookup, Compute, or Relate question?
You went through the table one row at a time, and for each row you did a lookup on the fixed column.
Have students type the code that will look up if animalA is fixed or not, then do the same with animalB. Suppose we wanted to do this for every animal in the table? This seems really repetitive, doesn’t it? We would keep typing the same thing over and over, but all that’s really changing is the animal. Wouldn’t it be great if Pyret had a function called lookup-fixed, that would do this for us?
Fortunately, we already know how to define functions using the Design Recipe!
Turn to The Design Recipe (Page 63) in your Student Workbook.
Step 1: Contract and Purpose
The first thing we do is write a Contract for this function. You already know a lot about contracts: they tell us the Name, Domain and Range of the function. Our function is named lookup-fixed, and it consumes a row from the animals table. It looks up the value in the fixed column, which will always be a Boolean. A Purpose Statement is a description of what the function does:
# lookup-fixed :: (r :: Row) -> Boolean
# Consumes an animal, and lookup the value in the fixed column
Since the contract and purpose statement are notes for humans, we add the # symbol at the front of the line to turn it into a comment. Note that we used "lookup" in the purpose statement and the function name! This is a useful way of reminding ourselves what the function is for.
Be sure to check students’ contracts and purpose statements before having them move on.
Step 2: Write Examples
Writing examples for Lookup questions is really simple: all we have to do is look up the correct value in the Row, and then write the answer!
# lookup-fixed :: (r :: Row) -> Boolean
# Consumes an animal, and looks up the value in the fixed column
examples:
  lookup-fixed(animalA) is true
  lookup-fixed(animalB) is false
end
Step 3: Define the Function
When defining the function, we replace the answer with the lookup code.
# lookup-fixed :: (animal :: Row) -> Boolean
# Consumes an animal, and looks up the value in the fixed column
examples:
  lookup-fixed(animalA) is true
  lookup-fixed(animalB) is false
end
fun lookup-fixed(r): r["fixed"]
end
Investigate
For practice, try using the Design Recipe to define another lookup function.
-
Use the Design Recipe to solve the word problem at the bottom of The Design Recipe (Page 63).
-
Type in the Contract, Purpose Statement, Examples and Definition into the Definitions Area.
-
Click “Run”, and make sure all your examples pass!
-
Type
lookup-sex(animalA)into the Interactions Area.
Defining Compute Functions 25 minutes
Overview
Students define functions that answer Compute Questions, again practicing the Design Recipe.
Launch
We’ve only been writing Lookup Functions: they consume a Row, look up one column from that row, and produce the result as-is. And as long as that row contains Boolean values, we can use that function with the .filter method.
But what if we want to filter by a Boolean expression? For example, what if we want to find out specifically whether or not an animal is a cat, or whether it’s young? Let’s walk through an example of a Compute Function using the Design Recipe, by turning to The Design Recipe (Page 64).
Suppose we want to define a function called is-cat, which consumes a row from the animals-table and returns true if the animal is a cat.
-
Is this a Lookup, Compute or Relate question?
-
What is the name of this function? What are its Domain and Range?
-
Is Sasha a cat? What did you do to get that answer?
To find out if an animal is a cat, we look-up the species column and check to see if that value is equal to "cat". Suppose animalA is a cat and animalB is a dog. What should our examples look like? Remember: we replace any lookup with the actual value, and check to see if it is equal to "cat".
# is-cat :: (r :: Row) -> Boolean
# Consumes an animal, and compute whether the species is "cat"
examples:
  is-cat(animalA) is "cat" == "cat"
  is-cat(animalB) is "dog" == "cat"
end
Write two examples for your defined animals. Make sure one is a cat and one isn’t!
As before, we’ll use the pattern from our examples to come up with our definition.
# is-cat :: (r :: Row) -> Boolean
# Consumes an animal, and compute whether the species is "cat"
examples:
  is-cat(animalA) is "cat" == "cat"
  is-cat(animalB) is "dog" == "cat"
end
fun is-cat(r): r["species"] == "cat"
end
Don’t forget to include the lookup code in the function definition! We only write the actual value for our examples!
Investigate
-
Type this definition — and its examples! — into the Definitions Area, then click “Run” and try using it to filter the
animals-table. -
For practice, try solving the word problem for
is-youngat the bottom of The Design Recipe (Page 64).
Synthesize
Debrief as a class. Ask students to brainstorm some other functions they could write?
These materials were developed partly through support of the National Science Foundation,
(awards 1042210, 1535276, 1648684, and 1738598).
Bootstrap:Integrated Oklahoma by Jen Poole
is licensed under a
Creative Commons 4.0 Unported License.
Based on a work at www.BootstrapWorld.org.
Permissions beyond the scope of this license may be available by contacting
schanzer@BootstrapWorld.org.
Method Chaining
Method Chaining
Students continue practicing their Design Recipe skills, making lots of simple functions dealing with the Animals Dataset. Then they learn how to chain Methods together, and define more sophisticated subsets.
Prerequisites |
|||||||||||||||||||
Relevant Standards |
Select one or more standards from the menu on the left (⌘-click on Mac, Ctrl-click elsewhere). CSTA Standards
K-12CS Standards
Next-Gen Science Standards
Oklahoma Standards
|
||||||||||||||||||
Lesson Goals |
Students will be able to…
|
||||||||||||||||||
Student-facing Lesson Goals |
|
||||||||||||||||||
Materials |
|||||||||||||||||||
Preparation |
|
||||||||||||||||||
Supplemental Resources |
|||||||||||||||||||
Language Table |
|
Design Recipe Practice 25 minutes
Overview
Students practice more of what they learned in the previous lesson, applying the Design Recipe to simple table functions that operate on rows of the Animals Dataset. The functions they create - in addition to the ones they’ve already made - set up the method-chaining activity.
Launch
The Design Recipe is a powerful tool for solving problems by writing functions. It’s important for this to be like second nature, so let’s get some more practice using it!
Investigate
Define the Compute functions on The Design Recipe (Page 67) and The Design Recipe (Page 68).
Synthesize
Did students find themselves getting faster at using the Design Recipe? Can students share any patterns they noticed, or shortcuts they used?
Chaining Methods 25 minutes
Overview
Students learn how to perform multiple table operations (sorting, filtering, building) in the same line of code.
Launch
Now that we are doing more sophisticated analyses, we might find ourselves writing the following code:
# get a table with the nametags of all the fixed animals, ordered by species
with-labels = animals-table.build-column("labels", nametag)
fixed-with-labels = with-nametags.filter(is-fixed)
result = fixed-with-labels.order-by("species", true)
That’s a lot of code, and it also requires us to come up with names for each intermediate step! Pyret allows table methods to be chained together, so that we can build, filter and order a Table in one shot. For example:
# get a table with the nametags of all the fixed animals, ordered by species
result = animals-table.build-column("labels", nametag).filter(is-fixed).order-by("species", true)
This code takes the animals-table, and builds a new column. According to our Contracts Page, .build-column produces a new Table, and that’s the Table whose .filter method we use. That method produces yet another Table, and we call that Table’s order-by method. The Table that comes back from that is our final result.
Teaching Tip Use different color markers to draw nested boxes around each part of the expression, showing where each Table came from. |
It can be difficult to read code that has lots of method calls chained together, so we can add a line-break before each “.” to make it more readable. Here’s the exact same code, written with each method on its own line:
# get a table with the nametags of all the fixed animals, order by species
animals-table
  .build-column("label", nametag)
  .filter(is-fixed)
  .order-by("species", true)
Order matters: Build, Filter, Order.
Suppose we want to build a column and then use it to filter our table. If we use the methods in the wrong order (trying to filter by a column that doesn’t exist yet), we might wind up crashing the program. Even worse, the program might work, but produce results that are incorrect!
Investigate
When chaining methods, it’s important to build first, then filter, and then order.
How well do you know your table methods? Complete Chaining Methods (Page 69) and Chaining Methods 2: Order Matters! (Page 70) in your Student Workbook to find out.
Synthesize
As our analysis gets more complex, method chaining is a great way to keep the code simple. But complex analysis also has more room for mistakes, so it’s critical to think carefully when we use it!
These materials were developed partly through support of the National Science Foundation,
(awards 1042210, 1535276, 1648684, and 1738598).
Bootstrap:Integrated Oklahoma by Jen Poole
is licensed under a
Creative Commons 4.0 Unported License.
Based on a work at www.BootstrapWorld.org.
Permissions beyond the scope of this license may be available by contacting
schanzer@BootstrapWorld.org.