Students explore an approach to recommending videos and predicting election outcomes. They develop and analyze decision trees to predict individuals’ purchasing decisions.
Lesson Goals |
Students will be able to…
|
Student-facing Lesson Goals |
|
Materials |
|
🔗Modeling Predictions 25 minutes
Overview
Students consider technologies that make predictions and recommendations, and then play a game to help them build a frame of reference for diagramming the decision-making process.
Launch
Consider each of the three situations described below:
-
You just finished watching a YouTube video. Another video appears… and it is exactly the kind of video you would want to watch.
-
Two individuals who work for the same company and earn the same salary apply for a loan by filling out the same online form at the local bank. One of them is granted a loan, but the other is not.
-
A news anchor displays a map with some states colored blue and others colored red. She explains that the map’s predictions for the upcoming election were developed using historical census data.
On the surface, these situations may not seem to have a lot in common. If you dig a little deeper, however, you will discover that, in each of these scenarios, a program leverages known outcomes to make new recommendations, decisions, and predictions.
-
What information do you think is used for recommending videos?
-
Viewing history, search history, channel subscriptions, likes, dislikes, google activity, "not interested" feedback
-
What information do you think is used for classifying loan requests?
-
Debt, assets, payment history, number of open accounts, delinquent accounts, income/revenue, expenses, overdrafts in the last 90 days
-
What information do you think is used to predict election outcomes?
-
Census data including voter race, gender, income level, party affiliation, and age, as well as prior years' results
Investigate
As a class, we are going to play a game to help us understand the decision-making process that decision trees imitate.
The game we are going to play is a simplified version of 20 questions. If students are familiar with 20 questions, discussing the strategies they use when playing the game will help them to make connections.
-
Show of hands: Have you ever played 20 Questions?
-
What are the rules of 20 questions?
-
1 player is “it”. They have to think of a secret person, place or thing. The other players can ask up 20 yes or no questions to help them guess the secret person, place, or thing.
-
What strategies do you use when choosing the questions you will ask, assuming you want to find the object with as few questions as possible?
-
Ask questions that are likely to eliminate many objects—but be careful! A question that is too narrow could end up resulting in very little information gained.
-
Start with questions that will quickly limit possibilities.

We’re going to play a modified version of that game. Here’s how it works:
-
In our game, the "secret" will be an object from one of six possible categories: spoon, knife, cup, plate, fork, and mug.
-
I will write one of them down on a piece of paper.
-
You will ask me yes/no questions (however many you need!) until you figure out how to categorize the object that I chose.
-
As you ask questions, I will record them in a diagram on the board.
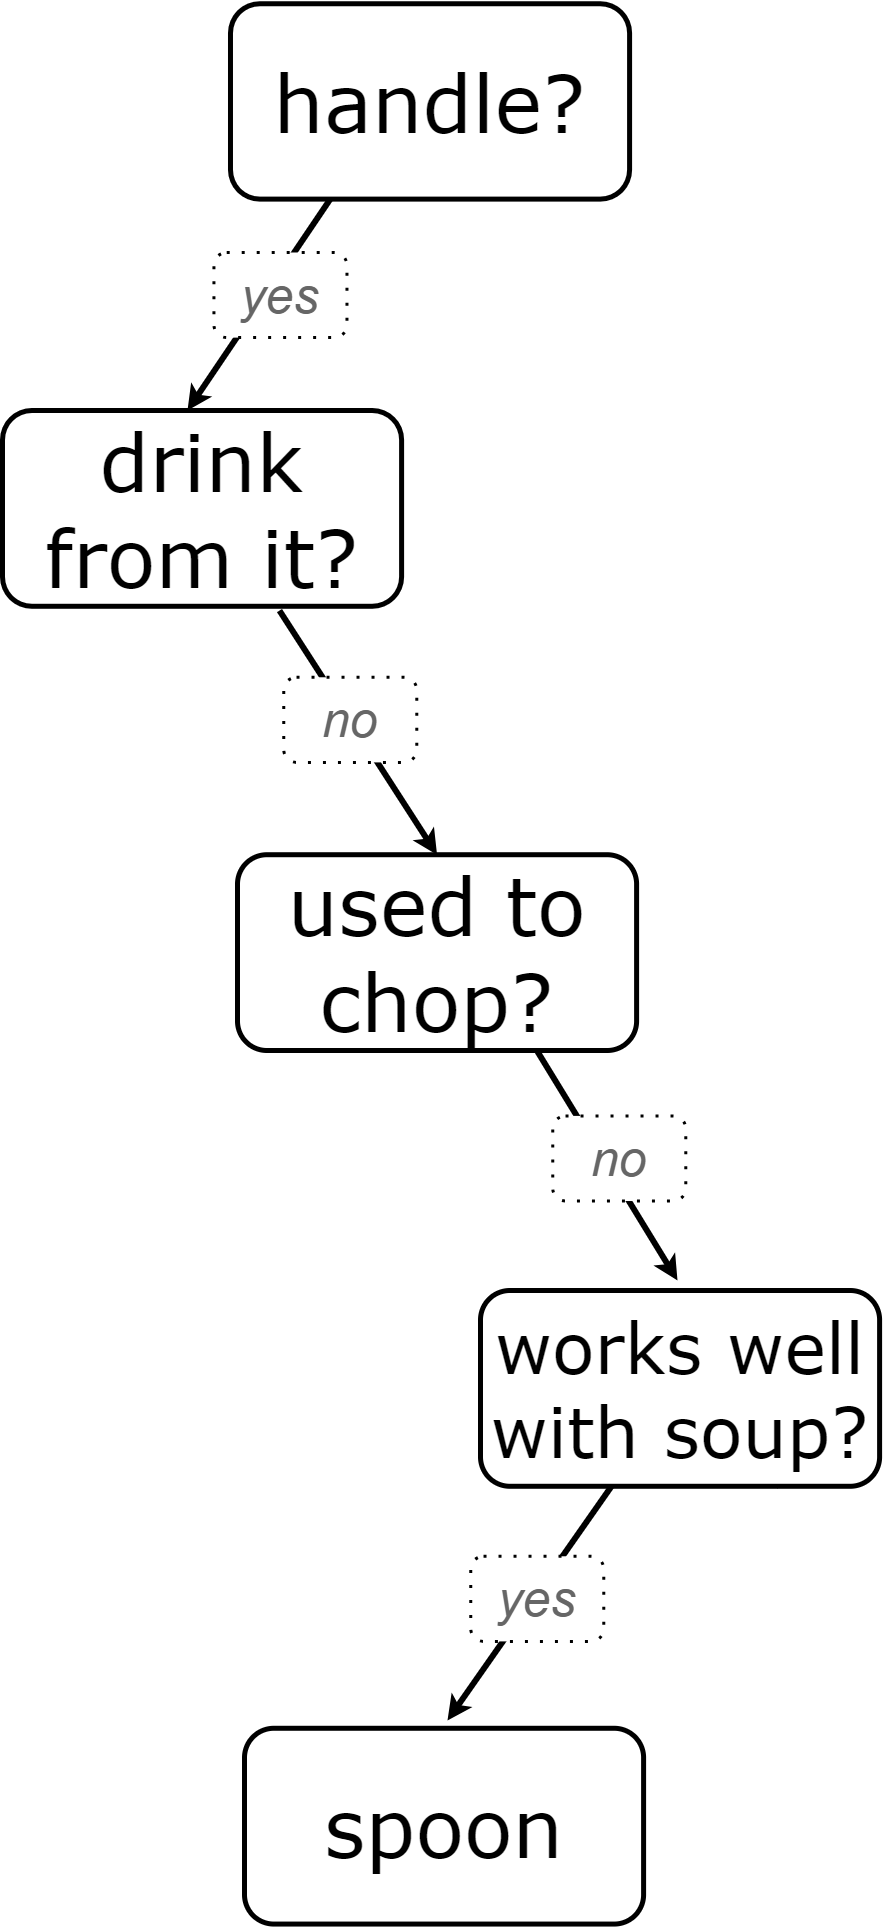
The first round of this game will produce a diagram similar to the one on the right, which models a game with the secret word "spoon". The number of questions required to "guess" the object—most likely between two and four—will depend on what your students ask.
Important diagramming conventions:
-
Each question asks about an (potential) attribute of the secret object.
-
Arrows are labeled with "yes" or "no" (the potential answers to the question).
-
"Yes" arrows point to the left, and "no" arrows point to the right.
As students ask questions, support them in noticing how effective their questions are in distinguishing the items on the list. "Does it have a handle?" splits the list into two groups: those that do not have handles (cup, plate) and those that do (spoon, knife, fork, and mug). Different questions could have split the objects differently.
Debrief the activity by posing the questions below. Note that the provided answers correspond with the sample diagram (on the right). Adjust responses to match the diagram that your class produces!
-
How many questions did we ask in order to determine how to correctly categorize the object?
-
This answer will depend on what your students ask!
-
In the example sequence we’ve diagrammed above, there were 4 questions.
-
Which items from our original list (spoon, knife, cup, plate, fork, and mug) did our very first question eliminate from the list of possibilities?
-
This answer will depend on what your students ask!
-
In the example sequence we’ve diagrammed above, there are four items on the list with handles (spoon, knife, fork, and mug). That means our first question--"does it have a handle?" eliminated two items, cup and plate.
-
Can anyone think of a different question that would have eliminated more items right off the bat?
-
Responses will vary. "Is it a utensil?" would have split the list in half, given that three items (spoon, knife, and fork) are utensils.
-
How did we decide which questions to ask?
-
We had to keep track of which items were eliminated and which items remained in order to pose useful questions.
-
What do you notice and wonder about the diagram I made?
-
Each question is in a rectangle.
-
The questions are connected by arrows, which point left when the answer is "Yes" and right when the answer is "No"
Let’s play another round of the game with a new item.
-
How many questions did we ask in order to determine the correct object this time?
-
How did we decide which questions to ask?
-
Which items from our original list (spoon, knife, cup, plate, fork, and mug) did our very first question eliminate from the list of possibilities?
-
How are the diagrams we drew similar and how are they different?
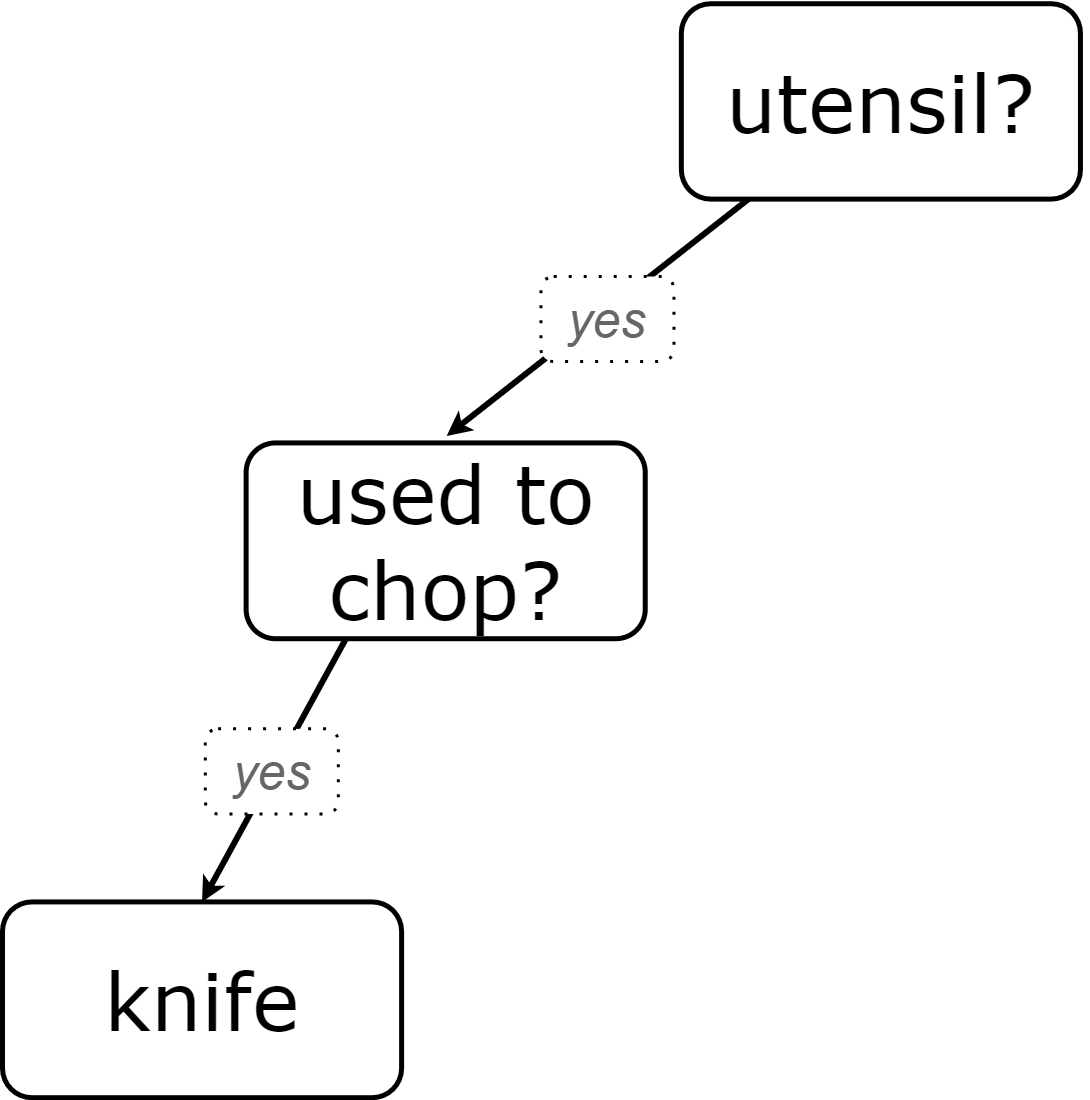
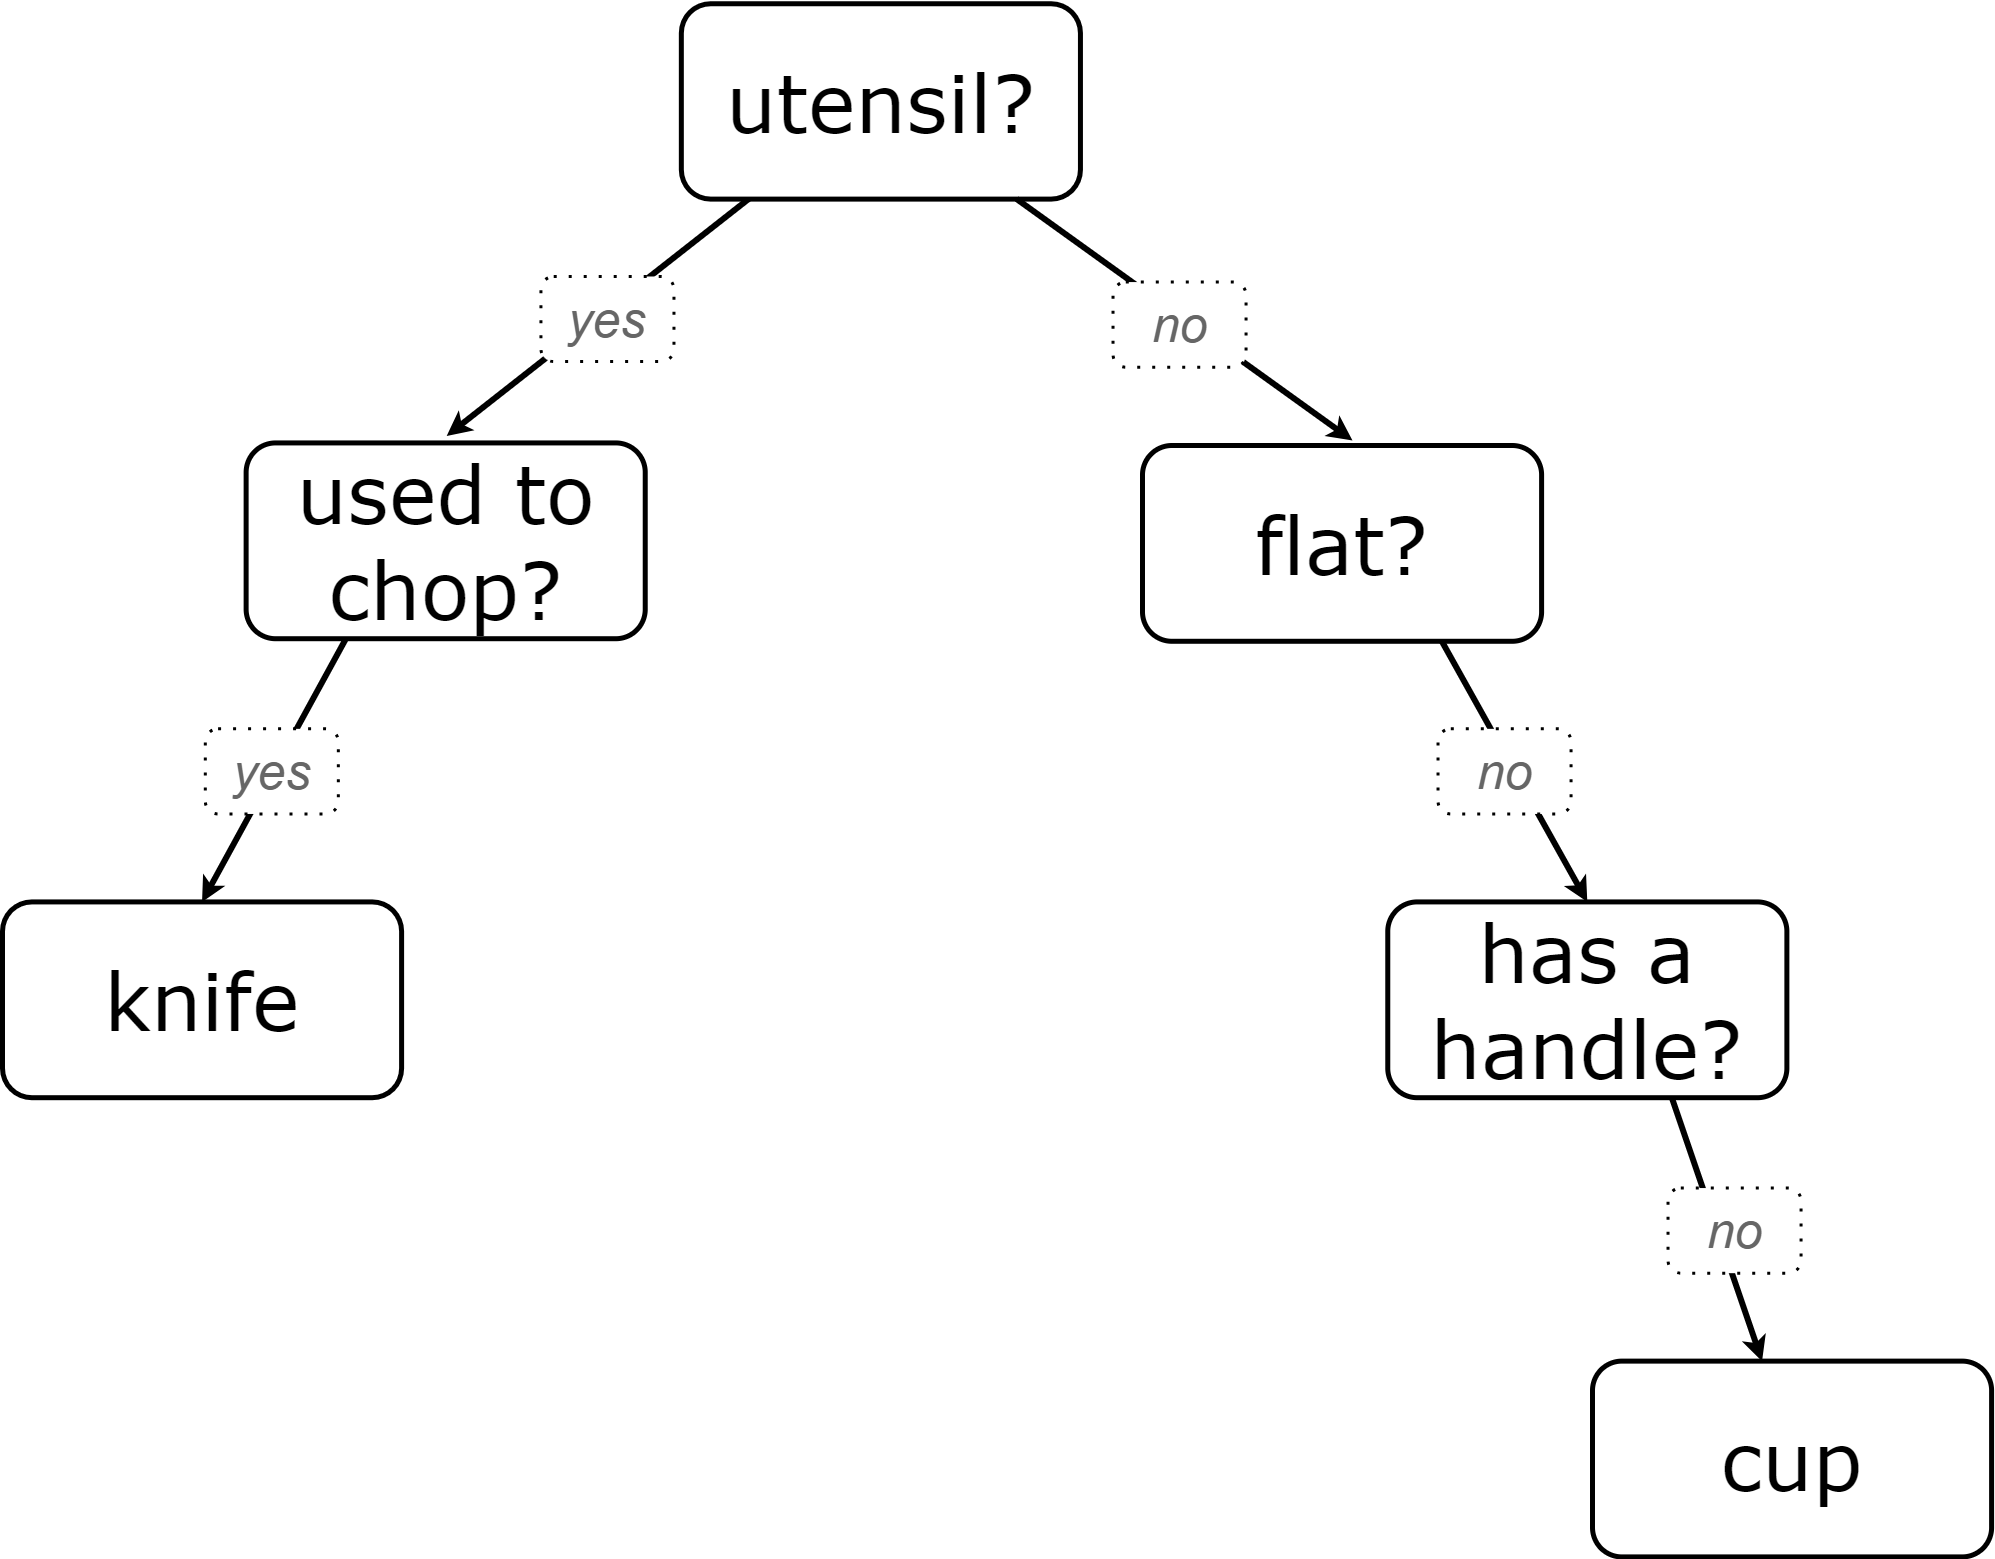
Let’s imagine that our first round had started with the question, "Is it a utensil?" and had led us to "knife". After the first round, our diagram might have looked like the diagram on the left (below). If the second round started with the same question, we could have just added to the original diagram… and we might have ended up with something like what you see on the right.
Round 1 |
Round 2 |
|
|
|
|
Notice that after Round 2 the topmost question — "is it a utensil?" — splits left ("yes, it is a utensil") and right ("no, it is not a utensil"). Our diagram begins with two unique paths to two unique categories. If we were asking categorization questions that were more complex than yes or no questions, we would have more than two unique paths!
With two paths branching off of the "utensil?" point, this diagram looks a bit like an upside-down tree (with the root at the top and the branches growing down). Computer scientists refer to data of this shape as a tree (and yes, they draw them upside-down). As we continue this exercise, our tree will gain more branches.
Synthesize
-
How does someone use a tree of questions to make predictions?
-
Ask the question at the root of the tree, then follow the branches to ask additional questions until we get to a category at the end of a path.
-
If we want to get to the correct categorization as quickly as possible, what would we want to be true about the first question we ask?
-
We would want it to split the list of options as evenly as possible to guarantee eliminating a significant number of options right off the bat.
🔗Decision Trees from Training Datasets 25 minutes
Overview
Students are introduced to decision trees and how they arise from datasets.
Launch
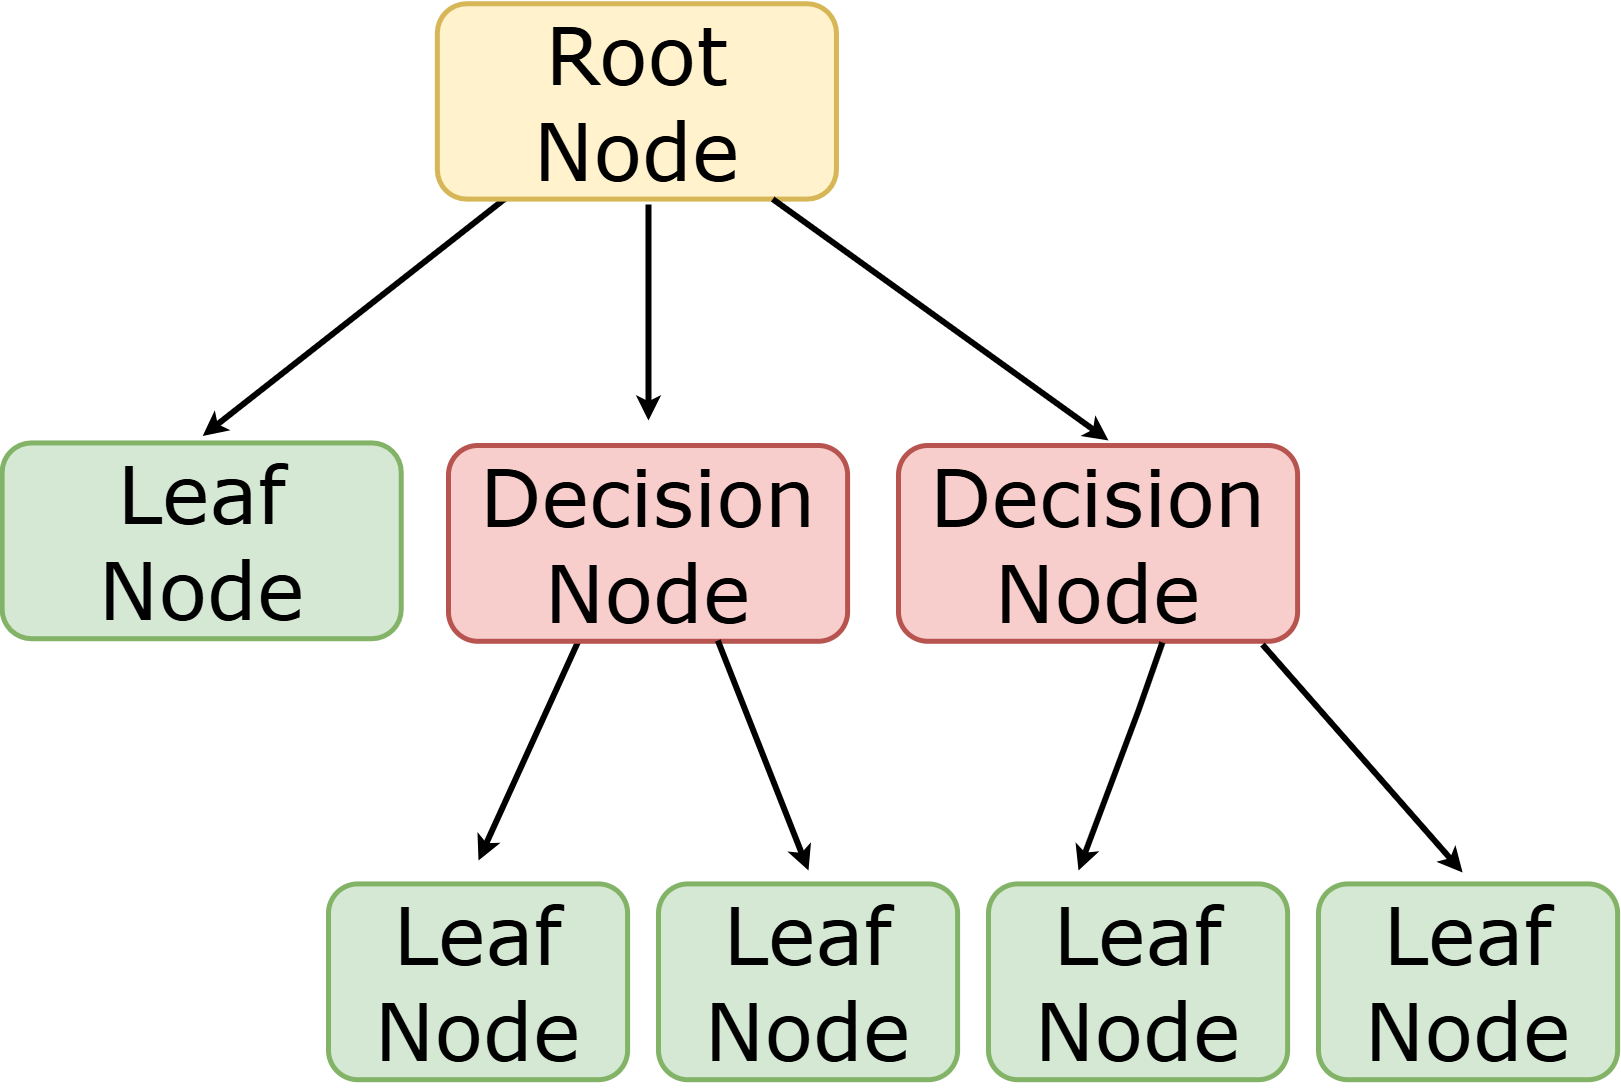
A decision tree is a tree-shaped model that shows decisions and their predicted outcomes. The diagram of our 20-questions game is a partial decision tree. Many computer programs that make recommendations or predictions utilize decision trees.
Unlike humans, who can generate their own questions, machine-learning algorithms generate decision trees from training datasets, using the column headers as questions.
Creating a decision tree is a form of supervised learning, because the training data already contains the desired outcomes (as one column), and the algorithm just learns a function that maps from input to outcomes.
Investigate
-
Let’s learn the terminology used to describe decision trees and apply it to the decision tree from our 20 questions game.
Decision Tree Terminology
-
A Decision node splits a dataset around the values in one of its columns. The attribute in the column serves as the "question" that is being asked.
-
The root node is the very top Decision node. It represents an entire dataset.
-
Splitting is the process of creating branches and additional nodes corresponding to subsets of a dataset based on values in one column.
-
A leaf node is a node that contains a predicted or recommended outcome. These outcomes come from a designated column in the original dataset. Leaf nodes have no outgoing branches.
-
The sequence of questions from the root node to an outcome is called a path.
Discuss the decision tree you made during your 20 questions game to help students identify the root node, decision nodes, leaf nodes, and paths on the tree so far.
-
Turn to the first section of Decision Tree: Spoon, Fork, Knife, Plate, Mug, Cup and take a few minutes to record your Noticings and Wonderings about how the dataset and decision tree are connected.
| Item | flat? | has-handle? | has-tines? | utensil? | used-to-chop? | category |
|---|---|---|---|---|---|---|
A |
no |
no |
no |
no |
no |
cup |
B |
no |
yes |
yes |
yes |
no |
fork |
C |
yes |
yes |
no |
yes |
yes |
knife |
D |
no |
yes |
no |
no |
no |
mug |
E |
yes |
yes |
no |
no |
no |
plate |
F |
no |
no |
no |
yes |
no |
spoon |
G |
yes |
yes |
no |
yes |
yes |
knife |
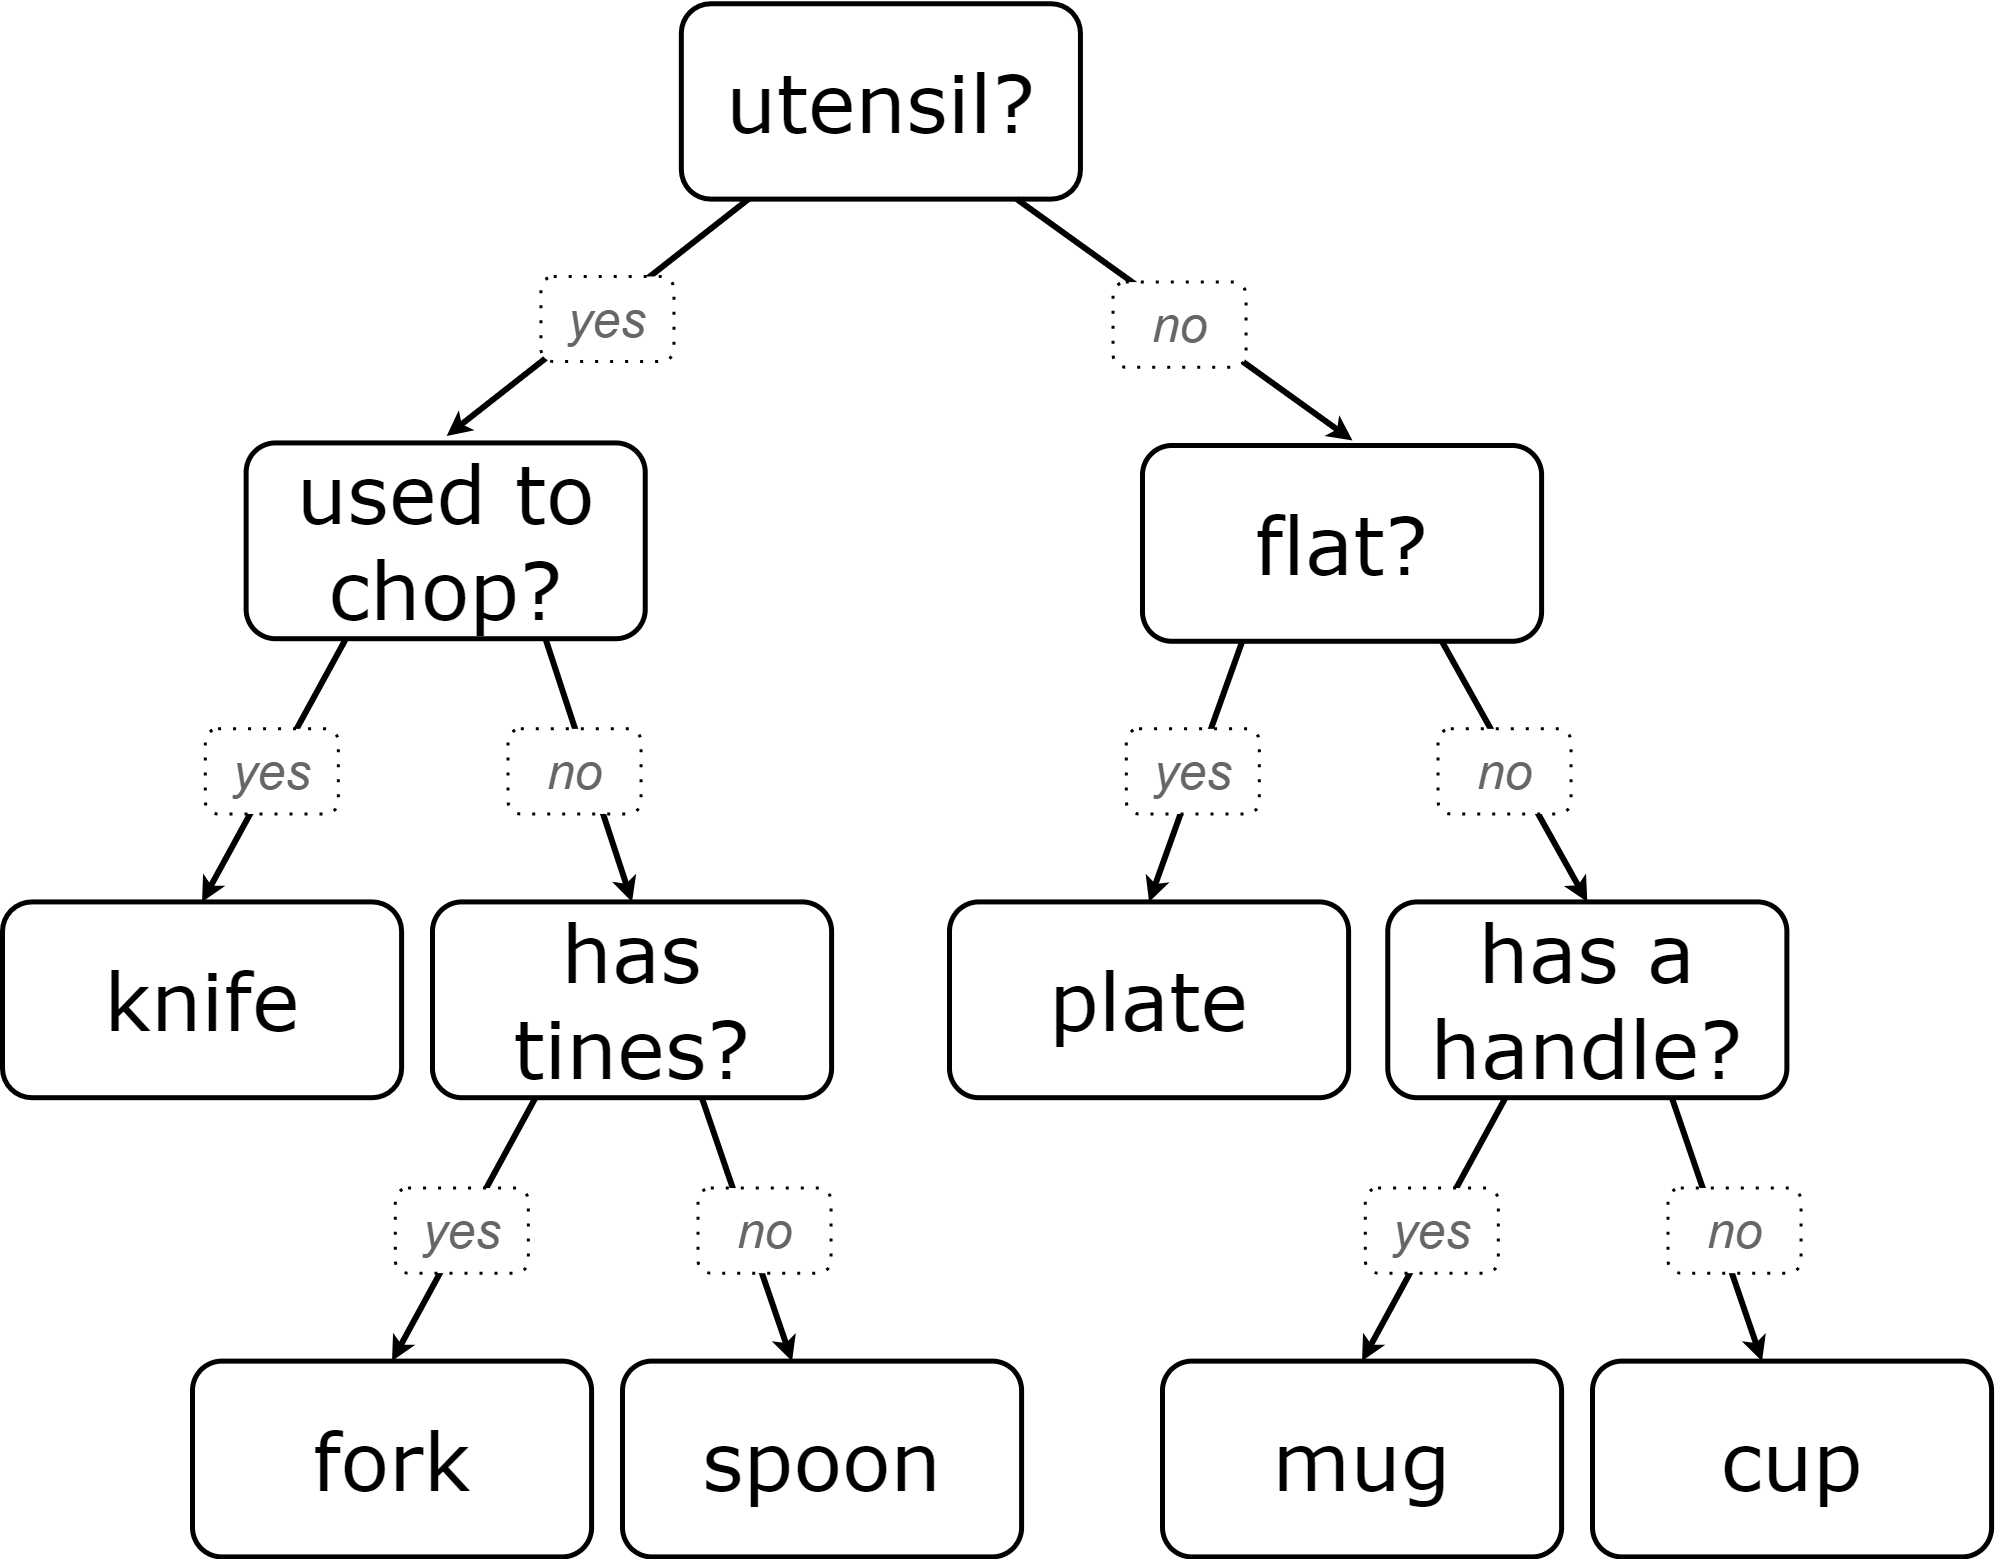
Let’s think about how the table translates to the tree and then consider how the tree connects back to the table.
-
Which column from the table does the tree predict?
-
"category"
-
Where do the column headers end up in the tree?
-
The predicted column name isn’t in the tree. Most of the others are the questions in our decision nodes.
-
Where is the "Item" column in the tree?
-
It isn’t part of the tree, because that column doesn’t contain information that is relevant to making a prediction. That column is there for other data-management purposes.
-
Where do the values in the "category" column end up in the tree?
-
They are in the leaf nodes.
-
Where do the values in the "used to chop?" column end up in the tree?
-
They label the branches out of the "used to chop?" decision node.
-
What rows of the table are we thinking about when the tree asks "used-to-chop?"
-
The rows that are utensils.
-
What rows of the table are we thinking about when the tree asks "has-a-handle"?
-
The rows that are neither utensils nor flat.
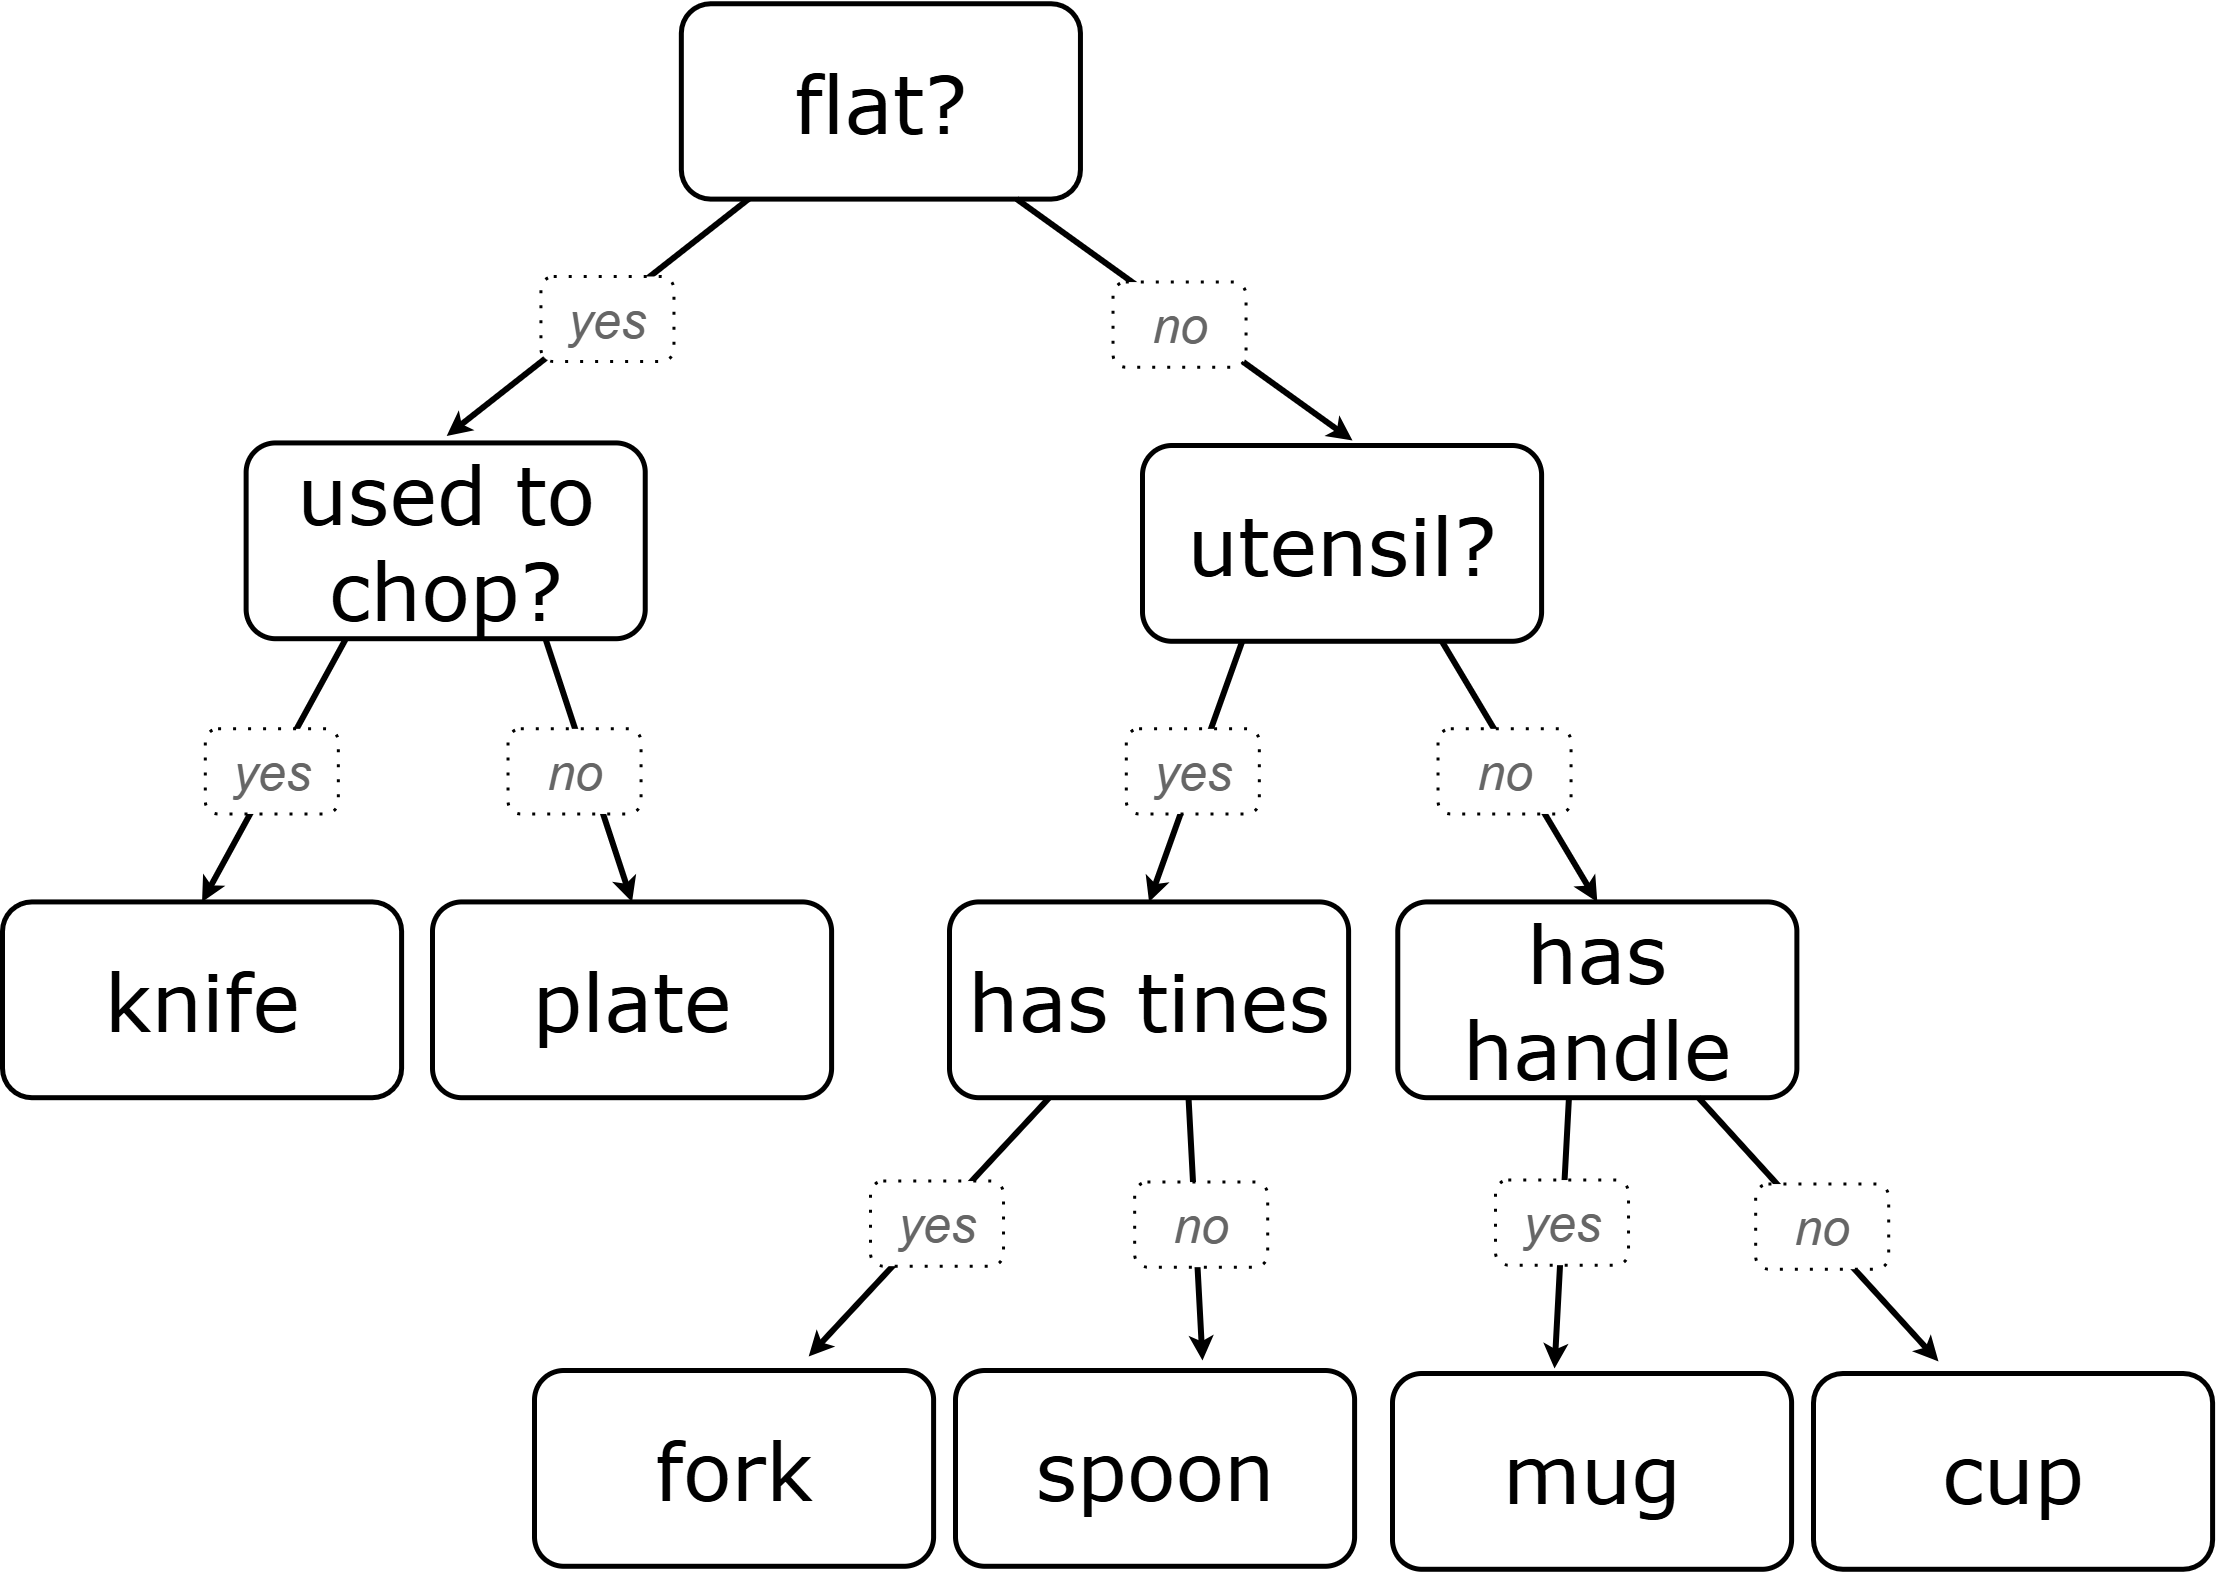
Turn to the second section of Decision Tree: Spoon, Fork, Knife, Plate, Mug, Cup and follow the directions to make a new decision tree from the same table, using flat? as the root node with used-to-chop as the decision node for "yes" and utensil? as the decision node for "no".
|
|
Take a look at the two decision trees (above) that we made for this dataset:
-
What do these trees have in common?
-
They have a root node, 4 decision nodes and 6 leaf nodes.
-
They have the same number of levels.
-
Each time they branch there are two options: yes/no.
-
How are they different?
-
The root node of the first decision tree splits the categories in half so that there are 3 leaf nodes on the left branch and 3 leaf nodes on the right. The root node of the second tree splits the categories into 2 leaf nodes on the left branch and 4 leaf nodes on the right.
-
The first decision tree has the same number of levels on the left and right branches, whereas the second decision tree has a shorter left branch than right branch.
Let’s use our decision trees to make predictions on new data (instead of just the training data).
Complete Testing and Comparing Decision Trees.
Invite students to share and explain their responses before emphasizing the main ideas, below.
You just observed that a decision tree
-
can accurately categorize items that were represented in the training dataset
-
can falter when offered inputs that were not represented
We can add more training data to improve the accuracy, but encountering new objects or situations is common in real-world settings. But these examples emphasize the importance of having a good representation (set of questions) of the objects or situations that we want to make predictions about!
When we were playing 20 Questions, we could draw on everything we know about knives, spoons, sporks, plates, bowls or mugs to generate questions. We could always add new questions if we hadn’t yet identified an object.
Computers build decision trees from datasets. The columns in a dataset are fixed before the tree gets generated. Since the questions can’t change on the fly, it is important that we start from robust training data that
-
has columns for enough attributes to distinguish between outcomes, and
-
has enough rows to capture different combinations of those attributes.
Let’s think about this issue of having enough training data.
-
What might determine whether we can create a training dataset with at least one row per combination of attributes?
-
There are two key factors:
-
How many columns are there?
-
How many values are possible in each column?
-
-
How many variables do you think a recommendation system like YouTube uses?
-
YouTube considers roughly one billion variables!
Synthesize
-
Will a decision tree always have the same number of leaf nodes as there were rows in the training dataset? Why or why not?
-
No. Generally multiple rows of a training dataset will have the same prediction. The training dataset we saw in this lesson section contained multiple knives, for example.
-
Explain how the decision tree and training dataset correspond to each other.
-
The column headers from the table are the questions that will get asked in the decision nodes of the decision tree.
-
The data in each column are the answers to those questions which become the arrow labels of the decision tree ("yes" and "no", for this dataset).
-
The output categories from the table are the leaf nodes in the decision tree.
🔗Decision Stumps: Optimizing Predictions 25 minutes
Overview
Students build a decision tree that predicts whether someone will purchase a video game.
Launch
Have you ever done some online shopping—say, for a new pair of sneakers—only to discover that, for the next several days, you encounter advertisements for sneakers lurking in every corner of the internet that you visit?!
Websites can store small data files called "cookies" on your device that can be used to remember details like where you were the last time you visited the site. One particular kind of cookie, the tracking cookie, helps companies compile large datasets about visitors. They then use machine learning to decide which ads to display.
How do decision trees built from large datasets decide — at every level and every node — which attributes are the most informative ones to ask questions about, so that they can make relatively accurate predictions, recommendations, and diagnoses?!
It turns out, there’s an algorithm for that, and it’s relatively straightforward.
Investigate
We’re going to create a decision tree that predicts whether customers at a particular online store will purchase a video game. We will use a training dataset of 14 different shoppers that indicates whether or not each one purchased a video game.
-
With your partner, look over the Training Dataset. What do you Notice? What do you wonder?
-
Possible responses:
-
Individuals in their twenties always buy the video game.
-
There are only three new customers; two out of three times, new customers buy the video game.
-
Can you foresee any problems with making predictions based on this dataset? If so, what are they?
-
Responses will vary.
-
We only have data on 14 visitors.
-
All of the visitors are between 14 and 38 years old.
-
We don’t know a lot about their gaming habits.
Our model will predict the value in the "buys game" column using the other columns as the questions.
Before we process any dataset, we should consider whether the data are at a good level of specificity for the problem. For video game purchases, do we expect the difference between 17 and 18 year olds to matter, or is a general "teenager" category sufficient? If our data are too fine-grained, our models might not detect patterns that would otherwise be meaningful.
For now, let’s agree to create three groups: teens, twenties, and thirties. We can compute a new column in our dataset with these categories (and will see that on the next worksheet, Decision Tree: Predicting Shopping Behavior — Part 1).
When we drew a decision tree for 20 Questions, we discussed starting with questions that might distinguish among the possible outcomes. Which variable in our training set might do this? The "age" column has three possible values, whereas "shopping history" and "interest in game" each have only two ("yes" or "no"). This suggests that "age" might be a good variable to put at the root of our tree.
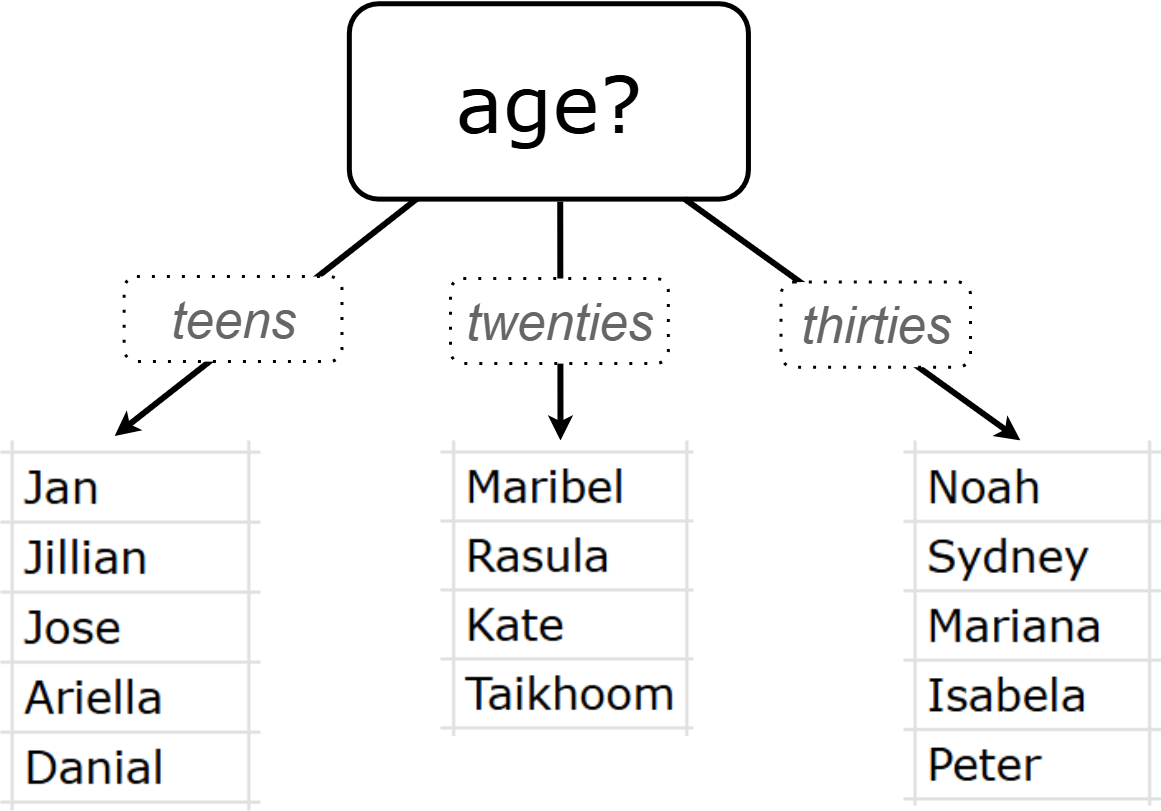
What does that initial node look like? For starters, we draw a decision node and label it with "age" (the column name we are exploring). We then add one branch for each of the possible values in the column (here, "teens", "twenties", and "thirties"). At the end of the arrows for each branch, we will build additional nodes for the subset of the dataset with the corresponding "age" value. Specifically:
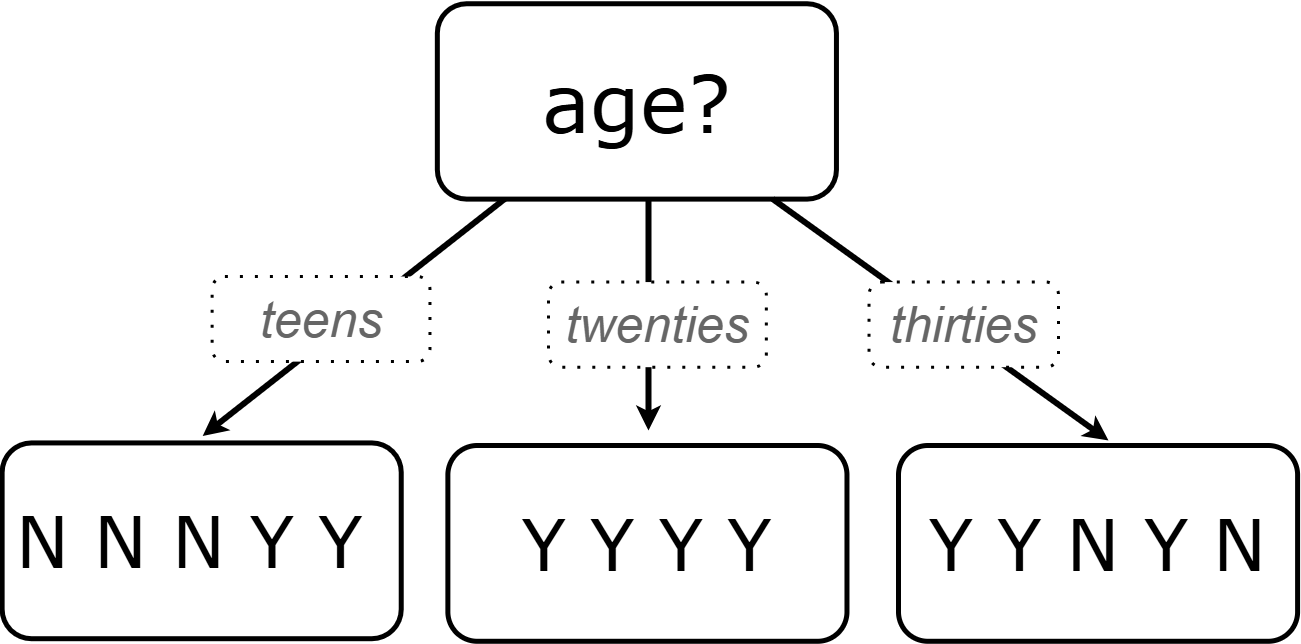
Before we create additional decision nodes, we want to explore the accuracy of prediction that we would get up to this point in the tree. To do this, we adapt our previous diagram to summarize the prediction and accuracy at each branch. We call this new diagram a decision stump. In the following picture, we have filled in the values from the "buys game" column for the dataset that remains within each "age" category.
-
What else do you Notice and Wonder about the decision stump?
-
Everyone in their twenties bought the game.
-
Three out of 5 people in their thirties bought the game.
-
On the other decision trees we’ve seen the arrows were labeled "yes" and "no", but here they’re labeled "teens", "twenties", "thirties".
-
Our decision stumps include nodes labeled like N N N Y Y.
Now, we need to determine two things:
-
What decision would we currently predict at each node, based on the training data?
-
We use whichever outcome appears most frequently in the remaining dataset (summarized by our N N N Y Y labels).
-
-
For what percentage of the rows at each branch is that prediction accurate?
Let’s complete the first section of Decision Tree: Predicting Shopping Behavior — Part 1 together to work out these details.
This stump has three branches because there are three values in the "age" column:
-
The left-most leaf node ("teens") represents the five teens in our training dataset: Jan, Jose, Jillian, Ariella, and Danial.
-
Jan, Jose, and Jillian did not purchase the game, so they are represented by the letter N (for "no").
-
Ariella and Danial did purchase the game, so they are represented by the letter Y (for "yes").
-
We illustrate the teens' decisions with the following shorthand: N N N Y Y
-
-
The other leaf nodes similarly summarize the purchasing habits of the individuals in their age groups.
We need to replace each outcome label (like N N N Y Y) with a predicted outcome.
-
What prediction should we make for teens? Why?
-
They won’t buy the game. We predict this because the majority of teens in the training data didn’t buy the game.
-
What predictions should we make for the other age groups? Why?
-
People in their twenties and thirties will buy the game. Everyone in their twenties bought the game, and a majority of those in their thirties bought the game.
Now that we have our predictions, we need to calculate how accurate they are for each of our age groups. We’ll start by placing checkmarks beneath each outcome (Y or N) that we would have correctly predicted.
We predicted that individuals in their teens would not purchase the game, so:
-
We place checkmarks by the Ns that represent Jan, Jose, and Jillian. Our prediction was correct for them.
-
We leave the Ys without checkmarks; our prediction was wrong for Danial and Ariella.
Our prediction was correct for 3 out of 5 individuals or 60% of the time.
-
Add checkmarks to the decision tree on Decision Tree: Predicting Shopping Behavior — Part 1 to indicate when our prediction was successful for customers in their twenties and thirties.
-
Calculate how effectively we predicted outcomes for each age group and the dataset as a whole (Question 4).
-
Finish the remaining questions in the first section.
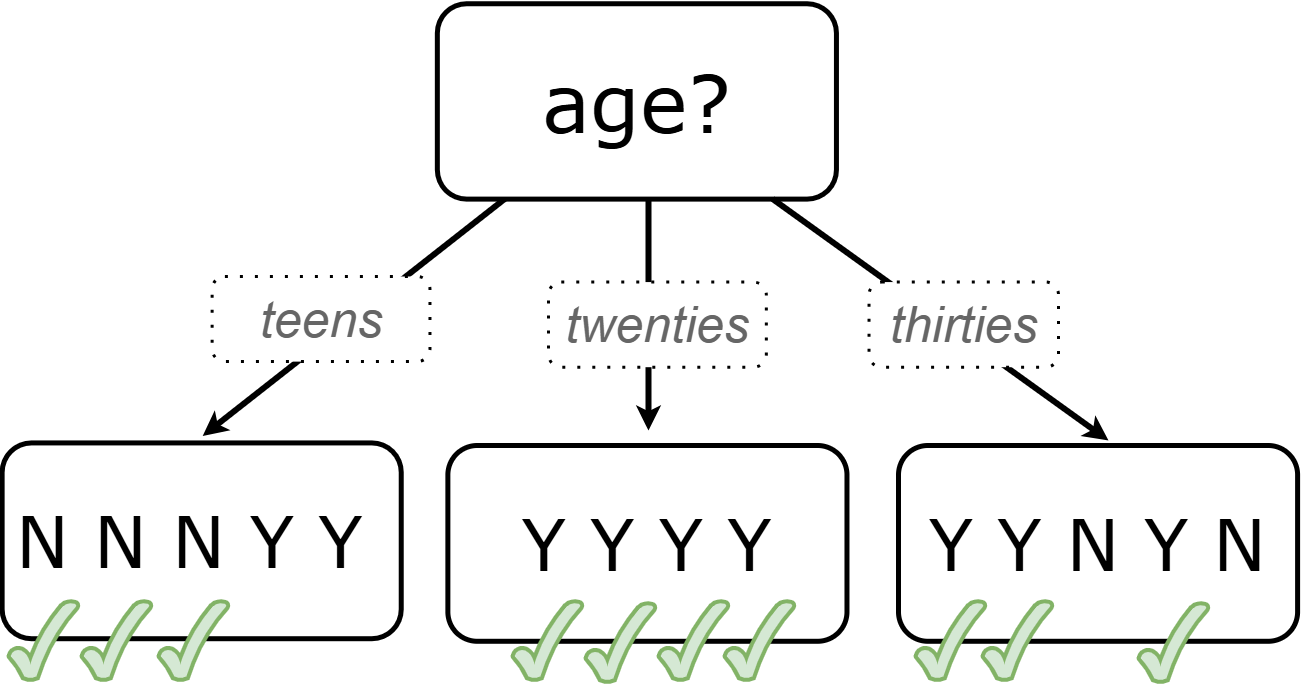
Our prediction was pretty effective! It was correct 10 out of 14 times! And for people in their twenties it was 100% accurate. Can we make the predictions more accurate for the other two groups? Yes! We still have two columns of data to consider:
-
Is the individual a previous customer, or a new customer?
-
Has the individual expressed interest in a particular video game?
As we move down the tree, our job is to figure out which column to use next.
Decision stumps help us decide how columns would impact our predictions.
-
Complete the last section of Decision Tree: Predicting Shopping Behavior — Part 1
-
Then complete Decision Tree: Predicting Shopping Behavior — Part 2.
-
You will create and compare different decision stumps for these columns of data.
-
The stumps will help you determine which question will produce the biggest improvement in accuracy.
-
-
Which attributes do you plan to utilize for the second level of the decision tree?
-
Interest in Games for Teens
-
Shopping History for People in their Thirties
-
Since our prediction for people in their Twenties was 100% accurate, we insert a leaf node with a decision to buy the game!
Complete the first section Building and Testing a Decision Tree.
-
What predictions did you make?
-
Interested teens will buy the game
-
Everyone in their twenties will buy the game.
-
Previous customers in their thirties will buy the game.
Complete the second and third sections of Building and Testing a Decision Tree to try making predictions about customers who were not in the training dataset.
Synthesize
-
What are some reasons that a decision tree might produce an inaccurate prediction or recommendation?
-
The prediction might represent closer to 50% of the training population rather than 100% of the population.
-
The training dataset might not completely represent the broader population, either in not having enough variables (columns) or enough samples (rows).
-
The training dataset could be inconsistent, in that the labeled outcomes for two rows are different while the rest of the columns have the same values.
-
After testing our tree, we discovered that it was not as accurate as we had expected or hoped. Can you think of concrete, real-world examples of how a training dataset might under represent a population?
-
Responses will vary.
-
Medical systems being trained on only adults, but not children.
-
Tutoring systems trained on only native speakers of a language.
-
Music recommendation systems being trained on a narrow set of genres.
-
We collapsed specific ages into categories (teenager, etc) to align the specificity of our data with the specificity of recommendations that we wanted from the decision tree. What if we had not done that, and instead created a branch for each individual age? How would individual branches have affected the decision tree and its recommendations?
-
The tree would have had many more branches and decision nodes.
-
We would likely have needed more training data with more samples at each age to get to acceptable accuracy.
-
You have learned that supervised learning includes three steps: (1) demonstration of the learning process, (2) function abstraction, and (3) using the function. Describe what each step includes for the supervised learning of a decision tree.
-
Demonstration: For decision trees, the demonstration is the labeling of the data so that the computer learns the desired outcome (or "correct answer") for each data point. During the lesson, we knew whether the individuals in our training set would buy the video game.
-
Function abstraction: Creating the decision tree yields a model of how variables affect outcomes.
-
Use: Follow the decision tree to find the predicted outcome for a new input (set of values for the question variables).
-
What are the key differences between building a decision tree and playing a game of 20 Questions?
-
In 20 Questions, we generate new questions as we play, whereas a decision tree is built from a fixed dataset.
-
In 20 Questions, the answers are all yes/no, whereas there can be multiple answers to a question in a decision tree.
-
In 20 Questions, we generate new questions each time we play the game. A decision tree is a model that will be used to make multiple predictions over the same input variables.
These materials were developed partly through support of the National Science Foundation, (awards 1042210, 1535276, 1648684, 1738598, 2031479, and 1501927).  Bootstrap by the Bootstrap Community is licensed under a Creative Commons 4.0 Unported License. This license does not grant permission to run training or professional development. Offering training or professional development with materials substantially derived from Bootstrap must be approved in writing by a Bootstrap Director. Permissions beyond the scope of this license, such as to run training, may be available by contacting contact@BootstrapWorld.org.

