Students investigate periodic relationships, by deciphering the patterns in a dataset with perfect periodic (sinusoidal) behavior using an inquiry-based model involving hypothesizing, experimental and computational modeling, and sense-making.
Lesson Goals |
Students will be able to…
|
Student-facing Lesson Goals |
|
Materials |
|
Preparation |
|
🔗Describing Periodic Models
Overview
Students are introduced to the basic form of sine and cosine functions, and become familiar with the terminology to describe them.
Launch
-
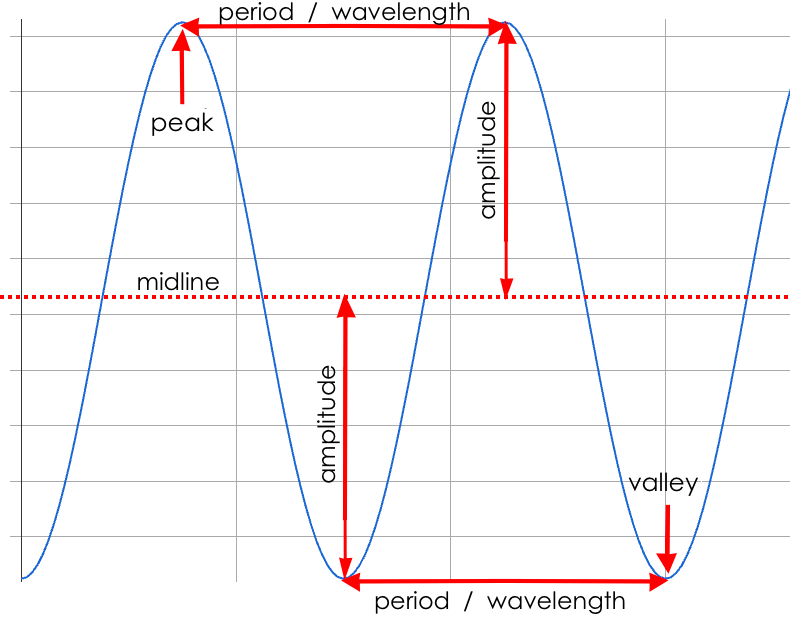
Complete Describing Periodic Functions using what you can learn from the diagram to come up with explanations for each of the terms.

-
What terms do you feel confident in your description of?
-
What terms do you have questions about?
-
Peaks — the highest points on the wave (also called Crests)
-
Valleys — the lowest points on the wave (also called Troughs)
-
Midline — a line (or curve!) that is always halfway between the peaks and the valleys
-
Amplitude — the distance from a peak or valley to the midline
-
Period — the distance over which the curve travels before it begins to repeat itself (one complete wave)
|
Note
|
Since periodic functions rise and fall repeatedly, there isn’t a single maxima or minima, but math books sometimes refer to each peak and valley as a "local maxima" or "local minima" |
You may want to print copies of Describing Periodic Models for students to complete in advance of the upcoming discussion about the ferris wheel data.

-
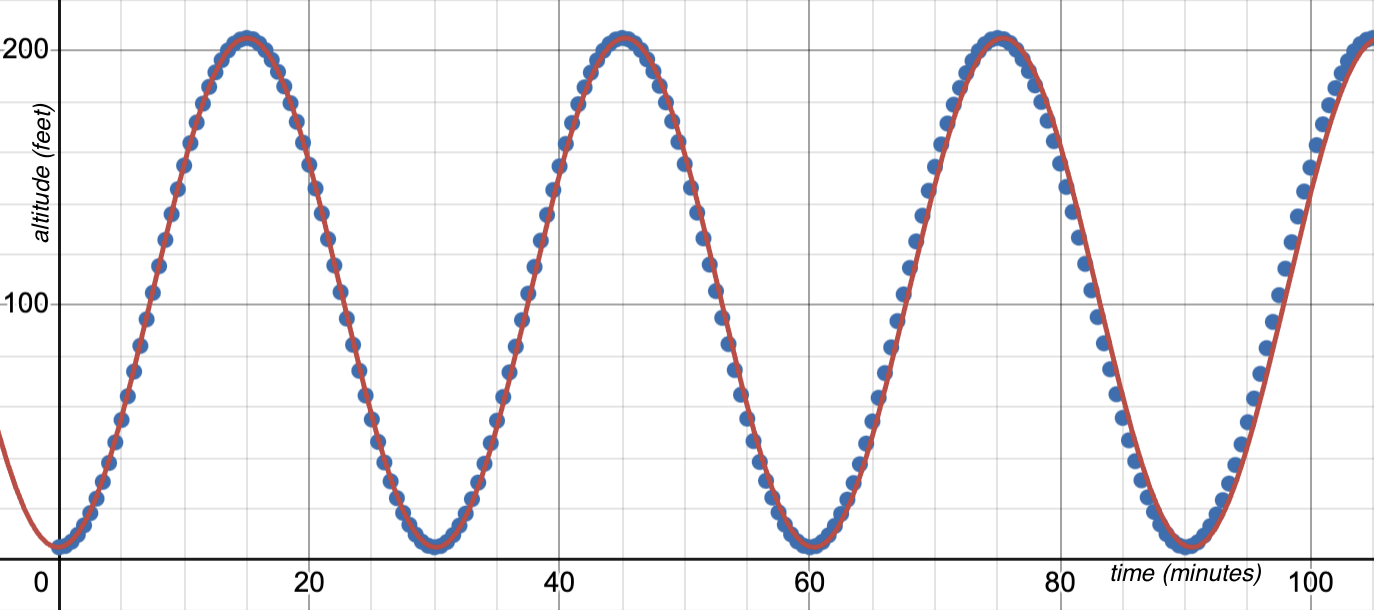
Where does the ferris wheel dataset appear to have peaks?
-
(15, 205), (45, 205) (75, 205), (105, 205)…
-
Where does the ferris wheel dataset appear to have valleys?
-
(0, 5), (30, 5), (60, 5), (90, 5)…
-
What does the period of this dataset appear to be?
-
30 minutes
-
Where does the midline of this dataset appear to be?
-
105 feet
-
What is the shape of the midline? Is it straight? Does it slope up or down?
-
It’s a straight, horizontal line (no slope)
-
What does the amplitude of this dataset appear to be?
-
100 feet
-
Turn to Matching Periodic Descriptions and match the graphs of periodic functions to their written descriptions.
-
What strategies did you use to match the graphs to the descriptions?
Investigate
Make sure you have created a link or code for your class to Exploring Periodic Functions (Desmos) and paced the class so they have access to Slide 1: Modeling the Ferris Wheel Dataset (sine).
Note: The desmos slider activity in this lesson sections uses Sine as the model. The second section of this lesson introduces the idea that we can use either sine or cosine to model periodic functions and includes other slider activities through which students will explore how they are related.
-
We are about to explore the model settings in the opposite side and the hypotenuse.">sine model for periodic relationships: f(x) = a sin(b(x − h)) + k
-
Take a moment to think back to other models we’ve seen and predict what effect each of the model settings will have on the shape of this model.
Some students may recognize k as the vertical shift, h as the horizontal shift, or a as some kind of multiplier that makes the peaks higher and the valleys lower. The point here is just to encourage them to think about what patterns they’ve already seen. We are about to experiment with Desmos sliders to investigate how each of these model settings influences the shape of the model.
-
Open the Desmos link I’ve shared with you. (The file should be called Exploring Periodic Models Desmos file.)
-
You should now be on Slide 1: Modeling the Ferris Wheel Dataset (sine).
-
Adjust the sliders to fit this data. How close can you get?
-
With your partner or group, experiment with the model settings of periodic models to complete these three pages:
As you debrief, give plenty of time for students to hear each other’s thinking! Concepts like amplitude and frequency can be difficult to describe, and having students reach a consensus on their definition in their own words will help deepen their understanding.
Amplitude (a)
Determines how much the curve rises and falls above the midline.
Period
The distance over which the curve travels before it begins to repeat itself (one complete wave). It can be measured from peak to peak, from valley to valley, or from any start point to an identical end point that follows both a peak and a valley.
Frequency (b)
The number of periods that occur over a 2π interval. $$\displaystyle \text{Period} = {2\pi \over\displaystyle \text{frequency}}$$
| Period | Frequency | |
|---|---|---|
When b = 1 |
2π |
1 |
When the period is cut in half, the frequency doubles |
π |
2 |
When the period doubles, the frequency is cut in half |
4π |
1/2 |
Horizontal Shift (h)
In periodic functions, the Horizontal Shift is sometimes called the Phase Shift.
-
When h < 0, the graph shifts to the left.
-
When h > 0, the graph shifts to the right.
Note: In the function definition f(x) = a sin(b(x − h)) + k, when h is positive it looks like it’s being subtracted.
Vertical shift (k)
The vertical shift is the amount the function is shifted up or down.
-
When k < 0, the graph shifts down.
-
When k > 0, the graph shifts up.
Synthesize
-
What similarities and differences do you observes between periodic functions and other kinds of functions we’ve seen?
🔗Connecting Sine and Cosine
Overview
Students dig deeper into the vocabulary for periodic functions, starting with their own words and gradually moving to a more formal understanding. They apply this understanding by returning to the Ferris wheel problem from the Exploring Carnival Ride Data lesson.
Launch
We’ve been working with opposite side and the hypotenuse.">sine models for periodic relationships: |
f(x) = a sin(b(x − h)) + k |
Another commonly used periodic model is the cosine relationship: |
g(x) = a cos(b(x − h)) + k |
Sine and Cosine relationships are closely related to one another, and each one can be expressed in terms of the other.
Investigate
Pace students to Slides 1 through 3 of Exploring Periodic Functions (Desmos).
-
Let’s return to the Exploring Periodic Models Desmos file.
-
With your partner, complete Modeling the Ferris Wheel Data.
-
For the first section you should still be on Slide 1: Modeling the Ferris Wheel Dataset (sine).
-
For the second section you’ll advance to Slide 2: Translating from sine to cosine.
-
For the third section you’ll advance to Slide 3: Modeling the Ferris Wheel Dataset (cosine).
-
-
When you finish the page, open the Ferris Wheel Starter File, and change the definitions of
fandgto match the models defined on Modeling the Ferris Wheel Data. How well do they fit?
NOTE: The altitude column of the Ferris wheel dataset has been rounded to make it easier for students to use. This rounding will result in some error in the model.
Suppose you needed to compute the model for a different Ferris wheel. Would you know how to use the radius and speed of the wheel to compute the model?
-
Complete Make Your Own Ferris Wheel! with your partner.
Synthesize
Periodic relationships involve repeating cycles. Like our Ferris wheel, they rise and fall along regular intervals.
-
Can you come up with some examples of periodic relationships?
-
For each one, can you estimate
-
the period of the relationship?
-
the amplitude?
-
the midline and vertical shift?
-
You’ll likely need to support students in thinking through what these terms mean in the context of their first example, to get the class started.
-
Suppose a student volunteers "the temperature, because it gets cold in the winter and warm in the summer":
-
The seasons change over the course of one year, so the period would be 365 days.
-
The temperature in your area might fluctuate between 95° in the summer and 25° F in the winter. That’s a range of 70° F, for an amplitude of 35° F.
-
The midline and the vertical shift are at 60° F (25 + 35 = 60).
-
-
Other ideas might include tides, phases of the moon, hours of daylight over the course of the year, etc.
Optional: Out-of-Seats Activity
-
Have groups of students go to whiteboards/flipcharts, and write down the periodic relationship they came up with.
-
Beneath the description, have them draw axes and their wave!
-
Ask them what the period is, then the x-axis, then the y-axis.
-
e.g. Phases of the moon:
-
Period is roughly 1 month.
-
The x-axis might be days.
-
For the y-axis, we might use "Percent of visible moon" or "number of lumens".
-
-
These materials were developed partly through support of the National Science Foundation, (awards 1042210, 1535276, 1648684, 1738598, 2031479, and 1501927).  Bootstrap by the Bootstrap Community is licensed under a Creative Commons 4.0 Unported License. This license does not grant permission to run training or professional development. Offering training or professional development with materials substantially derived from Bootstrap must be approved in writing by a Bootstrap Director. Permissions beyond the scope of this license, such as to run training, may be available by contacting contact@BootstrapWorld.org.
