Students are introduced to quadratic sequences and the parts of a parabola. Then they use our Desmos slider activity to explore how the values in the vertex form describe the shape of the model.
Lesson Goals |
Students will be able to…
|
Student-facing Lesson Goals |
|
Materials |
|
Supplemental Materials |
|
Preparation |
|
Key Points For The Facilitator |
|
🔗Quadratic Sequences
Overview
Students formalize their understanding of quadratic relationships, learning how to identify them arithmetically.
Launch
-
What do we know about Quadratic Relationships?
-
Answers will vary.
-
Their graphs are u-shaped, either rising, slowing, peaking, and falling or falling, slowing, bottoming out, and then rising again.
For practice identifying linear v. quadratic shapes on a graph, complete Classifying Scatter Plots.
Investigate
We’ve seen quadratic relationships that rise-and-fall or fall-and-rise. But sometimes we’ll encounter datasets that include only the rising part of the parabola or only the falling part, so we need to know how to recognize whether a sequence of x-y pairs is part of a parabola without looking for a change in direction.
Identifying Quadratic Relationships from a Sequence of numbers
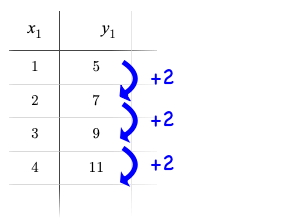 Remember that linear functions grow by fixed intervals, so the rate of change is constant.
In the table shown here, each time the x-value increases by 1, we see that the y-value increases by 2. This is true for any set of equal-sized intervals: a line needs to slope up or down at a constant rate in order to be a straight line!
If the rate of growth is constant, the relationship is linear.
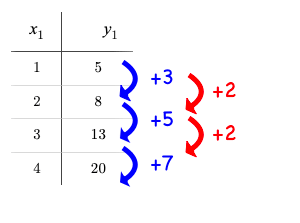 Quadratic functions grow by intervals that increase by fixed amounts! In the table to the right, the blue arrows show a differently-sized jump between identical intervals time, meaning the function is definitely not linear!
However, if we take a look at the difference between those differences(shown in red), we’re back to constant growth!
If the "growth of the growth" is constant, the relationship is quadratic.
Turn to What Kind of Model? (Tables), and look at the first two tables on the page (shown below). One of them shows a linear progression, while the other shows a quadratic progression.
1 |
|
||||||||||||||||
2 |
|
-
What do you Notice? What do you Wonder?
-
Which one is linear, and how do you know?
-
The second table is linear, because the y values growth is constant relative to x.
-
Which one is quadratic, and how do you know?
-
The first table is quadratic, because the y values "growth of the growth" is constant relative to x.
-
Identify whether each of the remaining tables on What Kind of Model? (Tables) is quadratic, linear or neither.
-
Use the space to the right of the table to show your work.
Debrief with students and encourage them to share the different strategies that they used. Note: When looking at real-world datasets that can be modeled by linear or quadratic functions, these patterns will not be evident in the tables, because the points won’t fit the function perfectly!
Synthesize
-
What strategies did you use to decide which tables were quadratic?
-
Answers will vary. But it’s important to make sure that students' thinking goes beyond identifying that a sequence is nonlinear and delves into confirming that the growth of the growth is constant.
-
What strategies did you use to decide between whether a table showed a relationship that was neither linear nor quadratic vs a table that showed no relationship?
-
Answers will vary. But if we can predict the next y-value, we know there is a relationship.
🔗Graphing Quadratic Functions
Overview
Students shift from numbers to graphs, as students learn the vocabulary for describing parabolas.
Launch
As we work with parabolas — and eventually fit them to Aaron Judge’s Baseball Batting Data — we need to know how to talk about and describe them.
-
Linear relationships can be described with terms like "slope" and "y-intercept". But what about quadratic relationships? Do parabolas have slope?
-
No. They curve because they do not have a constant rate of change.
-
Do all parabolas have x-intercepts?
-
No. Some do and some don’t!
-
Can you point out or describe other important parts of a parabola?
-
Even without knowing the names for these things, students might point to the vertex, the axis of symmetry, etc.
Terminology for Talking about Parabolas
| vertex | y-intercept | x-intercept |
|---|---|---|
|
|
|
The point at which a parabola "changes direction" and goes from climbing to sinking (or vice versa). |
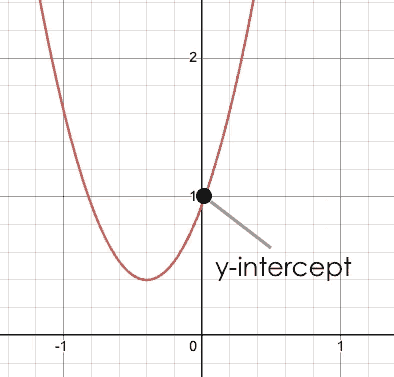
Like linear models, parabolas always cross the y-axis once when x = 0, and we call this the y-intercept. |
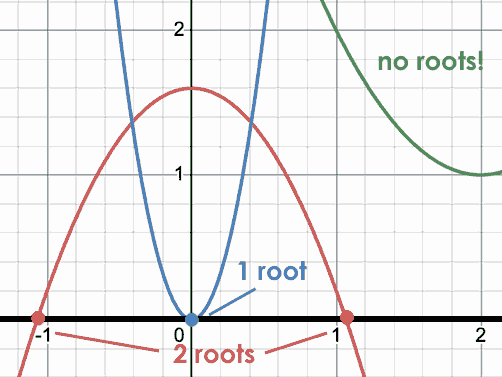
Also known as roots or zeros. A quadratic function can cross the x-axis once, twice, or not at all. |
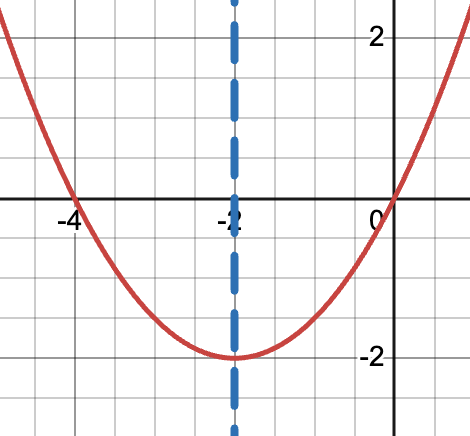
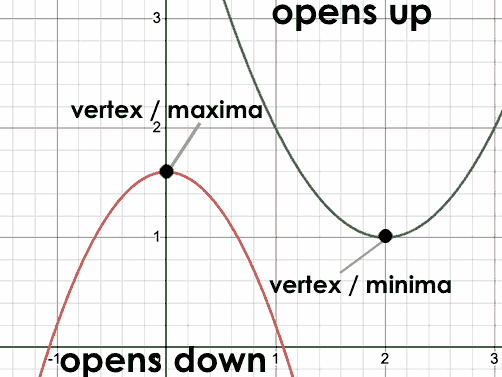
There are two more specific terms that we can use to describe a parabola’s vertex:
-
The maximum is the vertex of a parabola that "opens down."
-
The minimum is the vertex of a parabola that "opens up."
For parabolas representing y as a quadratic function of x, we can imagine a vertical line through the vertex that splits the parabola into two congruent parts that mirror one another. This line is the axis of symmetry, which for quadratics always passes through the vertex (these axes exist in other shapes and functions, as well!).
Turn to Parabolas to apply our new terminology by sketching and labeling some graphs.
Investigate
One form of a quadratic model looks like this: f(x) = a(x − h)2 + k
Let’s find out how each of the model settings influences the shape of the parabola!
Where does "Model Settings" come from?
Educators choose vocabulary carefully, assigning clear names to concepts that are abstract and important. As an example, what vocabulary word should math teachers use for a, b, and c in the parent function for below?
f(x) = ax2 + bx + c
-
"Variable" means "the input the function needs", which is clearly x
-
"Coefficient" would apply to a and b, because they are part of terms that use x.
-
"Constant" is perfectly accurate, but that word is often conflated with the constant term in an equation. Most calculus students would argue that only c is a constant!
We believe the lack of a distinct term for such an important concept is a problem in math education. We’ve chosen to use "Model Settings" as a neutral term for these values. Every type and form of model has them, and each setting determines the behavior of a model.
Make sure you have created a link or code for your class to Exploring Quadratic Functions (Desmos).
-
Open Exploring Quadratic Functions (Desmos).
-
Use Slide 1: Transforming Parabolas to complete Graphing Quadratic Models
-
When you’re done, continue your exploration with Slide 2: Do horizontal shifts correspond to vertical shifts for quadratic functions?
Quadratic Coefficient (a)
-
How do you make a parabola "narrower"?
-
Increase the value of a
-
How do you make a parabola "wider"?
-
Decrease the value of a
-
How do we know from the equation whether a parabola opens up or down?
-
If a is negative, it will open down. If a is positive, it will open up.
-
What value of a will result in a linear model?
-
Zero
The quadratic coefficient a tells us whether the parabola opens up or down, and how tightly it hugs the axis of symmetry.
Horizontal Shift (h)
-
How do you translate a parabola to the left?
-
Increase the value of h.
-
How do you translate a parabola to the right?
-
Decrease the value of h.
-
What does an h of zero tell us about the axis of symmetry?
-
It’s the y-axis.
The horizontal shift h tells us where the axis of symmetry hits the x-axis, which means it also tells us the x-coordinate of the vertex.
Vertical Shift (k)
-
How do you translate a parabola up and down?
-
Change the value of k
-
How can you find the coordinates of the parabola’s vertex, just by looking at the equation?
-
h tells us the x-coordinate, and k tells us the y-coordinate.
-
In linear functions, we know that translate any horizontal shift to translation with a vertical shift. Is this also true for quadratic functions? Why or Why not?
-
No. That only worked for linear functions because they extend indefinitely without changing direction. Quadratic functions curve, so horizontal shifts and vertical shifts don’t translate to each other.
Like the y-intercept of a linear model, the vertical shift k translates the parabola up and down.
Synthesize
-
What key characteristics of a scatter plot would provide the clue that we should look for a quadratic model rather than a linear model?
-
Why do some parabolas have roots and others don’t?
-
If the minimum is negative, it will fall below the x-axis. That will make the parabola cross the x-axis twice as it opens up, so there will be two roots. Similarly, there will be two roots if the maximum is positive.
-
If the minimum or maximum is zero it will fall directly on the x-axis and there will be one root
-
If the minimum is greater than zero or the maximum is less than zero, the parabola won’t cross the x-axis and there won’t be any roots.
-
What is the difference between a minimum and a maximum?
-
A minimum is the vertex of a parabola that opens up, while a maximum is the vertex of a parabola that opens down.
🔗Additional Practice
These materials were developed partly through support of the National Science Foundation, (awards 1042210, 1535276, 1648684, 1738598, 2031479, and 1501927).  Bootstrap by the Bootstrap Community is licensed under a Creative Commons 4.0 Unported License. This license does not grant permission to run training or professional development. Offering training or professional development with materials substantially derived from Bootstrap must be approved in writing by a Bootstrap Director. Permissions beyond the scope of this license, such as to run training, may be available by contacting contact@BootstrapWorld.org.

