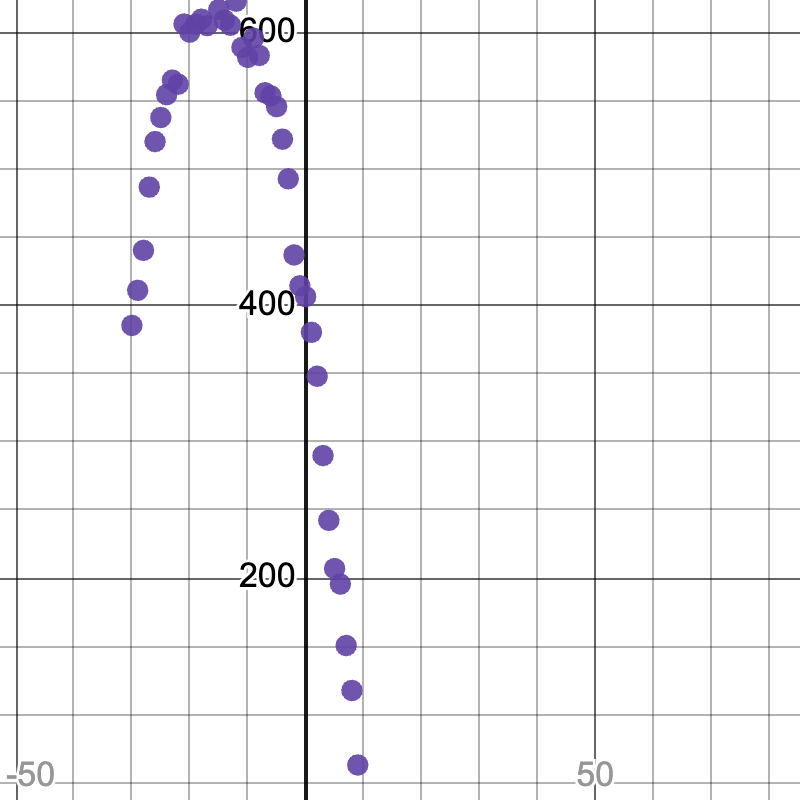
Students are introduced to the modeling advantages of using factored and standard forms of quadratic functions and learn to build a model algebraically from a sample of 3 points on the curve.
Lesson Goals |
Students will be able to…
|
Student-facing Lesson Goals |
|
Materials |
|
Supplemental Materials |
|
🔗Other Forms of Quadratic Models
Overview
Students are introduce to Factored Form: f(x) = a(x − r1)(x − r2) and Standard Form: f(x) = ax2 + bx + c, and why they each have a role to play in modeling.
Launch
 We’ve learned how to derive our model from a scatter plot using Vertex Form, which works beautifully when the vertex is visible in the data. But what if the vertex isn’t visible? Does that make it impossible to find a model for data with a quadratic relationship?
As with Linear Models, mathematicians and data scientists use different forms of Quadratic Models to make model-fitting and calculations easier depending on what information they have on hand.
Factored Form: f(x) = a(x − r1)(x − r2)
As is the case with vertex form, the sign of a tells us whether the parabola opens up or down.
Factored form makes it really easy to identify where the parabola crosses the x-axis, otherwise known as the roots of the function.
Since these points lie on the x-axis, we know the y-coordinate of any root is always zero. And y will equal zero if x = r1 or x = r2, because that will make one of the parenthetical terms be zero, and anything times zero is zero.
Factored form is especially useful if you don’t know the vertex, but you can easily find the roots (from looking at the scatter plot or having only those two data points)!
This is a great place to include factoring activities!
-
Take an existing worksheet where students have to derive the factored form when given two roots, and frame it as "a dataset shows us the roots, but nothing else — can you come up with a model that fits?"
-
To go even deeper, ask students if they can come up with more than one quadratic model that fits those roots, and have students observe that the only difference between any two such models is a.
Standard Form: f(x) = ax2 + bx + c
The Standard form of any polynomial is written with terms from highest to lowest degree. The standard form of quadratic models puts the quadratic (squared) term first, followed by the linear term, followed by the constant term for vertical shift. As was the case with vertex and factored form, a tells us whether the parabola will open up or down.
Standard form offers two benefits:
-
Knowing that an equation is in standard form makes it easy for someone to know exactly what kind of equation it is just by looking at the first term.
-
If you need to find the roots but don’t have easy access via Factored form, the model settings in standard form can always be computed using the quadratic formula, no matter what they are.
This is a great time to include your textbook’s traditional content on standard form!
-
Complete What can we learn from each form of a Quadratic Function?.
-
Then complete What Kind of Model? (Definitions).
Let’s compare them side-by-side:
| Vertex Form | Factored Form | Standard Form |
|---|---|---|
f(x) = a(x − h)2 + k |
f(x) = a(x − r1)(x − r2) |
f(x) = ax2 + bx + c |
|
|
|
Easy to find the vertex |
Easy to find the roots |
Easy to decompose the function into quadratic, linear, and constant parts |
Investigate
Let’s try to use standard form to build a model from samples.
-
Open your copy of the Aaron Judge Starter File.
-
With your partner, complete Build a Model from Samples — Batting Data.
Synthesize
-
How close did the model you built from samples get to the one you created visually using Desmos sliders?
-
Which method did you like better?
🔗Additional Exercises
NOTE: While the fuel efficiency dataset used in the optional materials we’ll be offering throughout our quadratics lessons is based on real data obtained from the Transportation Energy Book, it has been augmented with fictional data in order to provide a sufficiently-rich dataset for student modeling. You can find out more about this augmentation in the README tab of the dataset.
These materials were developed partly through support of the National Science Foundation, (awards 1042210, 1535276, 1648684, 1738598, 2031479, and 1501927).  Bootstrap by the Bootstrap Community is licensed under a Creative Commons 4.0 Unported License. This license does not grant permission to run training or professional development. Offering training or professional development with materials substantially derived from Bootstrap must be approved in writing by a Bootstrap Director. Permissions beyond the scope of this license, such as to run training, may be available by contacting contact@BootstrapWorld.org.
