Students take a closer look at how functions can work together by investigating the relationship between revenue, cost, and profit.
Prerequisites |
|
Relevant Standards |
Select one or more standards from the menu on the left (⌘-click on Mac, Ctrl-click elsewhere). Common Core State Statements
Older Statements
|
Lesson Goals |
Students will be able to:
|
Student-Facing Lesson Goals |
|
Materials |
Bootstrap Formative Assessments
|
Preparation |
|
Supplemental Resources |
|
Key Points for the Facilitator |
|
- function
-
a mathematical object that consumes inputs and produces an output
Warmup
Students should have their workbook, pencil, and be logged into WeScheme and have their workbooks with a pen or pencil.
Problem Decomposition 30 minutes
Overview
Students are introduced to word problems that can be broken down into multiple problems, the solutions to which can be composed to solve other problems. They adapt the Design Recipe to handle this situation.
Launch
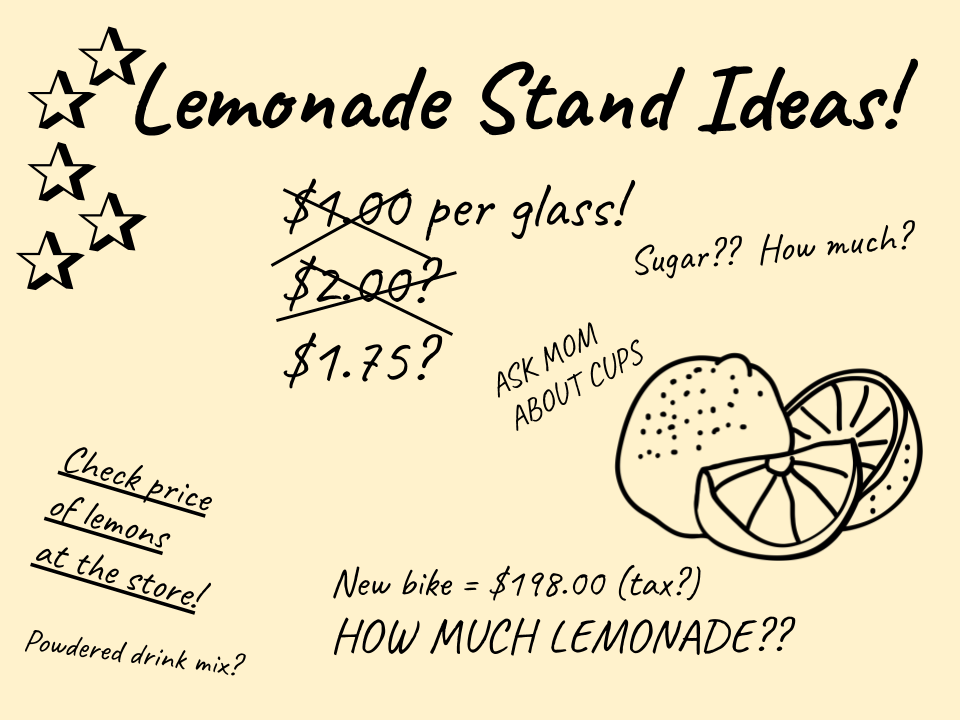
Display the following image:
Lemonade Stand Ideas
 🖼Show image
Notice and Wonder What do you notice? What do you wonder? |
One example of a relatioship we can find in this situation is that Sally takes in $1.75 for every glass she sells:
What other relationships can you find here?
(Give students a chance to discuss and brainstorm)
-
Every glass sold brings in $1.75 in revenue
-
Every glass sold costs $0.30 in costs, such as lemonds, sugar and water
-
Every glass sold brings in some amount of profit: it costs a certain amount to make, but it brings in another amount in revenue
Investigate
Students form groups and brainstorm their ideas for functions. Students can use any strategies they’ve learned so far.
Strategies for English Language Learners MLR 7 - Compare and Connect There are several correct ways to write the functions needed for Sally’s Lemonade. Have students compare methods and develop understanding and language related to mathematical representation and methods. What are the advantages of the different solutions? What are some drawbacks? |
-
What is the difference between revenue and profit? Revenue is the total amount of money that comes in, profit is the remaining money after cost has been subtracted.
-
How could Sally increase her profits? By decreasing her costs, raising her prices (which increases revenue), by selling more lemonade.
-
What is the relationship between profit, cost, and revenue? Profit = Revenue - Cost
Students work with their partners to develop their function models for revenue (Page 44), cost (Page 45), and profit (Page 46), using the Design Recipe.
While students are working, walk the room and gauge student understanding. There is more than one correct way to write the profit function! Encourage discussion between students and push students to develop their thinking on the advantages and disadvantages of each correct solution.
Synthesis
This activity started with a situation, and students modeled that situation with functions. One part of the model was profit, which can be written several ways, for example:
(define (profit g) (- (* 1.75 g) (* 0.30 g)))
(define (profit g) (* (- 1.75 0.30) g))
(define (profit g) (* 1.45 g))
(define (profit g) (- (revenue g) (cost g)))-
Which way is "best", and why?
-
If lemons gets more expensive, which way requires the least amount of change?
-
If sugar gets less expensive, which way requires the least amount of change?
Big Ideas
-
profitcan be decomposed into a simple function that uses thecostandrevenuefunctions. -
Decomposing a problem allows us to solve it in smaller pieces, which are also easier to test!
-
These pieces can also be re-used, resulting in writing less code, and less duplicate code.
-
Duplicate code means more places to make mistakes, especially when that code needs to be changed.
Top-Down vs. Bottom-Up 20 minutes
Overview
Students explore problem decomposition as an explicit strategy, and learn about two ways of decomposing.
Launch
Top-Down and Bottom-Up design are two different strategies for problem decomposition.
When thinking Bottom-Up, we start with the small, easier relationships first and then build our way to the larger relationships. In the Lemond Stand example, we had you write the lower-level functions &emdash; cost and revenue &emdash; first, and then gave you the chance to use them in the higher-level profit function. This is called Bottom-Up design.
When thinking Top-Down, we start with the "big picture" and then worry about the details later. For example, we could have started with profit, and kept track of all the lower-level functions we would need to write. This is called Top-Down design.
Investigate
Consider the following situation:
Jamal’s trip to Thailand requires him to drive 20 miles to the airport, take a plane 9,000 miles to Thailand, and then a bus 6 miles to his hotel. The average speed when driving to the airport is 40mph, the average speed of an airplane is 575mph, and the average speed of his shuttle bus is 15mph
Setting aside time spent waiting at the airport or for the bus, how long is Jamal in transit?
This problem can be decomposed in Top-Down or Bottom-Up fashion. Describe what your steps would be in each solution (for extra credit, you can actually compute the answer!).
Synthesize
Make sure that students see both strategies, and have them discuss which they prefer and why.
These materials were developed partly through support of the National Science Foundation,
(awards 1042210, 1535276, 1648684, and 1738598).  BS:Games by Jen Poole, Emmanuel Schanzer, Ed Campos Jr, and Dorai Sitaram
is licensed under a
Creative Commons 4.0 Unported License.
Based on a work at www.BootstrapWorld.org.
Permissions beyond the scope of this license may be available by contacting
schanzer@BootstrapWorld.org.
BS:Games by Jen Poole, Emmanuel Schanzer, Ed Campos Jr, and Dorai Sitaram
is licensed under a
Creative Commons 4.0 Unported License.
Based on a work at www.BootstrapWorld.org.
Permissions beyond the scope of this license may be available by contacting
schanzer@BootstrapWorld.org.