You can read our other entries on the subject: UI, The Definitions Area, and User Testing
In Bootstrap, students discover functions that draw all kinds of images, as well as functions that combine them in different ways. A student can, for example, display a triangle rotated 45 degrees, inscribed inside a circle. Images are opaque datatypes - how does a screen reader describe an image? A common solution is to annotate them with "This is an Image", and have the screen reader leave it at that. But if a picture is worth a thousand words, that's a lot of missing information!
 Our runtime builds scene graphs to represent images (think "sentence diagrams", but for pictures), which are flattened into a single image when it's time to render them to the screen. The first step in building useful descriptions is to annotate the scene graphs themselves. The TriangleImage data structure, for example, is now tagged with the text "a triangle of side-length <side length>". The RotateImage data structure now contains the description "an image rotated <degrees> degrees: <image description>". This way, the annotations can be flattened into a combined description in the same way that the images are flattened into a combined picture. If the triangle is passed into the rotate function, for example, the description becomes "an image rotated 45 degrees: a triangle of side-length 50".
This gets us part of the way there, but remember that images also have colors. Just because a programmer can't see colors doesn't mean it's appropriate to hide that piece of information! A well-designed, accessible program should always strive to provide as much of the same information to all users as possible: leaving out the color of an image fails to meet this standard.
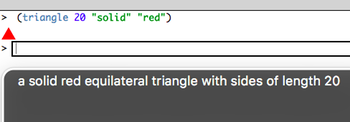
Many colors have names associated with them, which can be referenced programmatically as strings. "Purple", for example, might map to the RGB value rgb(128, 0, 128). We can use these strings to describe an image, making the result of (circle 40 "solid" "green") read as "a solid green circle of radius 40". We're in business!
Of course, not all colors have names. A program might construct a color programmatically, such as (make-color 66 33 99). If the browser doesn't have a built-in name for this color, what do we do? Well, Gentle Reader, this is where we leave behind the clear-cut rules of computer programming, and delve deeper into the gray area of human perception. Fasten your safety belt, put away your tray tables, and if you caught the pun in the previous sentence, there's a bag in the seatback pocket in front of you.
One option would be to give up, and report all colors as RGB numbers. This compounds the problem of abstract information: "255, 0, 0" is pretty useless. It also makes it impossible for a blind student to answer a word problem that uses color names. One might imagine an assignment that asks students to "write a function that takes in a number and draws green triangles of that size" - if the output doesn't at least say "green", how will a blind student know if they've solved it? We need a way to come up with a name for any color.
 Suppose we wanted to solve this problem just for shades of red. Let's lay out every shade of red from dark to light, and call the resulting spectrum "RedSpace." Of course, coming up with a unique name for every shade of red is ridiculous! But what if we labeled three points in RedSpace as "light" "medium" and "dark"? We could take any shade of red and give it a minimally-useful description based which of these three colors is its nearest neighbor. The colors near "light red" can all be pretty-well described as "light red". But how do we do this for all colors? How do you find the nearest-neighbor in "ColorSpace"?
 Conveniently, the nearest-neighbor problem is actually nothing more than the Distance Formula (a topic we cover quite thoroughly in Bootstrap!). The distance formula works in 3 dimensions (or more!) just as well as it does in 2: just add the squares of the difference in every dimension, then take the square root of the sum. If we plot the space of all colors with the colors whose names we do know, then we can use the Pythagorean Distance to find out which named color is the nearest neighbor of an arbitrary point in that space.
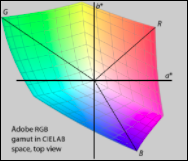
 Of course, there are lots of different ways to think of "ColorSpace". Is it 3-dimensional, with an axis for every primary color? Is it pinched in places where humans can't perceive the differences between shades? How does one map all the colors? Color Theory and Color Spaces are a fascinating area of study, and it turns out there are dozens of models to choose from. In one model two shades might be very close together (red is close to dark red), while in another they are not (black is closer to dark red). The model you choose matters. In Bootstrap, we chose LAB space for several reasons. First, LAB is device-independent, meaning it does not rely on the particular screen a student is using. Second, LAB represents the space of all perceivable colors - we want to accurately describe colors the way human being see them!
In our software, we store LAB values of every named color that has a string equivalent. When the Scene Graph tries to describe a color that it doesn't recognize, it converts the RGB value to an LAB one, and then searches the list of known LAB values to find the nearest-neighbor. Fortunately, we only have a small number of named colors, so this search is fast even on mobile phones. If we had thousands of named colors, we could use k-d trees to make the search efficient. Ultimately, our search for an accurate description of color for the blind required a deep dive into the specifics of how sighted people perceive color (paging Alanis Morissette!).
 Of course, Bootstrap students can use images besides the ones the make. In fact, they can use any image on the web: (bitmap/url "http://www.somewebsite.com/apple.png") will evaluate to the photo of an apple. But how do we describe this to a visually-impaired user? A little Artificial Intelligence to the rescue! Google's Vision API is a powerful tool for describing images, and thanks to generous support from none other than Vint Cerf, we've been able to harness this API to descibe these images! Bootstrap is grateful to Google, and to Vint!
Now that we can describe images, we can also even read animations frame-by-frame. In fact, to our knowledge, the WeScheme environment is the first one to ever describe arbitrarily-complex animations! Right now our solution is naïve, so we read every frame of an animation - no matter how little has changed from the previous frame. This could easily be improved, by taking the difference between each frame's scene graph and then describing only the difference. Unfortunately, our limited resources mean we need to leave this untouched for now (you can help!), but someday...
This initiative is made possible by funding from the National Science Foundation and the ESA Foundation. We'd also like to extend a huge thank-you to Sina Bahram, for his incredible contributions, support and patience during this project.
Posted by January 30th, 2017