Students investigate relationships in data about the spread of Covid in 2020, discovering that the shape of the relationship is neither linear nor quadratic!
Lesson Goals |
Students will be able to…
|
Student-facing Lesson Goals |
|
Materials |
|
Preparation |
|
🔗Exploring the Data
Overview
Students explore the Covid dataset, focusing on the growth in positive test cases for the state of Massachusetts (they will eventually explore other states later on).
Launch
In late 2019, COVID-19 began to spread across the globe. Most of us heard terms like "flatten the curve" and "infection rate" in videos and on the news.
Even in the Spring of 2020, very few people understood the impact Covid would have on the world. But Data Scientists who were looking at the data knew differently. Let’s take a look at some of that data!
Investigate
-
We’re going to look at the daily total of confirmed, positive cases for New England (Rhode Island, Maine, Vermont, New Hampshire, Massachusetts, and Connecticut) from summer 2020 until the end of the year.
-
Open the Covid Spread Starter File, select "Save a Copy", and click "Run."
-
Working in pairs or small groups, complete Exploring the Covid Dataset.
Why just New England, starting from June 9th?!?
This dataset is available for all 50 states (and Washington, D.C!), but for pedagogical purposes we’ve written the starter file to pull only data from New England.
And even within New England, we’ve artificially constrained this dataset, showing only the data from June 9th to December 26th, 2020. We’ve made this choice in order to showcase the most purely-exponential behavior of the infection curve, for the sake of this lessons' math learning goals.
For students who are farther along in mathematics, we recommend showing them all the data through 2020, starting in January rather than June. The first portion of the infection curve shows a gradual, linear growth pattern before exploding in the Fall of 2020. A purely exponential function will under-predict the growth during this time period, adding significant friction to the exponential modeling goal of this unit!
(The functions necessary to model this kind of growth have multiple terms showing different kinds of growth, and are just out of reach for students right now. Students can return to this unit once they’ve learned about hybrid models in later lessons.)
Based on the strength of your students, we encourage you to choose the data that best fits your learning goals.
To use all available data, open the Covid Spread Starter File and change the source sheet on line 7 from "New England" to "All".
Synthesize
 Discuss in groups or pairs, and prepare to share out to the class:
-
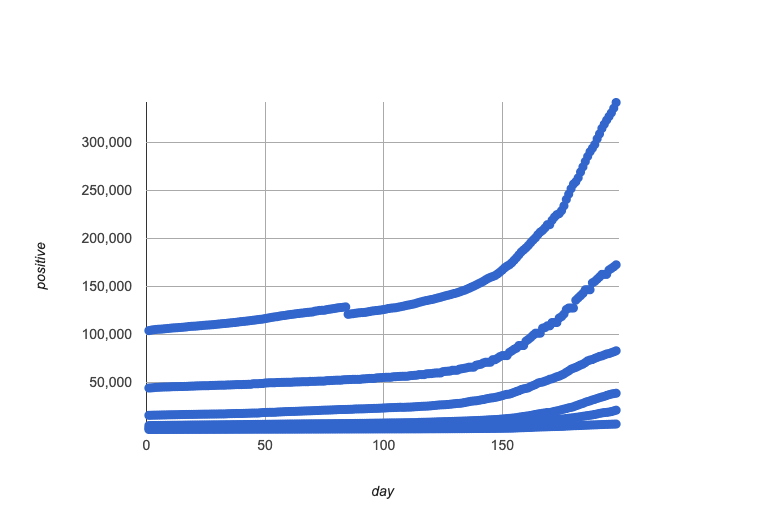
Based on the look of the scatter plot you just made, do you think there’s a strong relationship here?
-
If we fit a curve or straight line to this data, do you think it would fit the scatter plot well?
Review student answers to confirm that students have made a number of observations:
-
There appears to be more than one relationship in this dataset.
-
Every relationship appears to be extremely strong.
-
Most/all of these relationships appear to be nonlinear.
🔗Fitting Linear Models
Overview
Students use Pyret to perform linear regression on the data from Massachusetts and discuss whether or not the optimal linear model is a good fit for the data.
Launch
Let’s start out by looking at just one state. We’ll use Massachusetts for this investigation, but you can do your own investigation about any state you like after finishing this one!
Investigate
-
Turn to Linear Models for Covid in Massachusetts, and complete the first two questions.
-
In the Definitions Area, find the definition of
is-MAunderneath the comment# Define some helper functions -
With your partner, come up with an explanation of what you think this function does
-
A few lines farther down, find the definitions of
MA-table. What do you think is happening here? -
Don’t be afraid to experiment by changing the code!
-
The first part of this code defines a new function called
is-MA, which tests a single Row to see ifstate == "MA".
# is-MA :: Row -> Boolean
# consumes a Row, and checks if state == "MA"
fun is-MA(r): r["state"] == "MA" end-
The second part uses Pyret’s
filterfunction. This function consumes a table (in out example,covid-table) and a function (is-MA), and produces a new table containing only rows for which that function returnstrue. This new table — containing only rows in Massachusetts — is given the nameMA-table.
MA-table = filter(covid-table, is-MA)
-
Complete Linear Models for Covid in Massachusetts.
The definition MA-table = filter(covid-table, is-MA) filters our dataset, keeping only the rows for which state = "MA". We could create other helper functions like is-MA, and use them with the filter function to get datasets for any state we want!
-
Did you see a correlation between date and the total number of confirmed, positive cases in this dataset?
-
Yes
-
Describe it.
-
The points are tightly clustered along a curve that grows slowly at first and then faster and faster.
-
It appears to be a strong nonlinear relationship.
Linear models capture straight-line relationships, where one quantity varies proportionally based on another. In linear models, we expect the response variable to grow by equal amounts over equal intervals in the explanatory variable.
-
Are linear models a good fit for this data?
-
Why or why not?
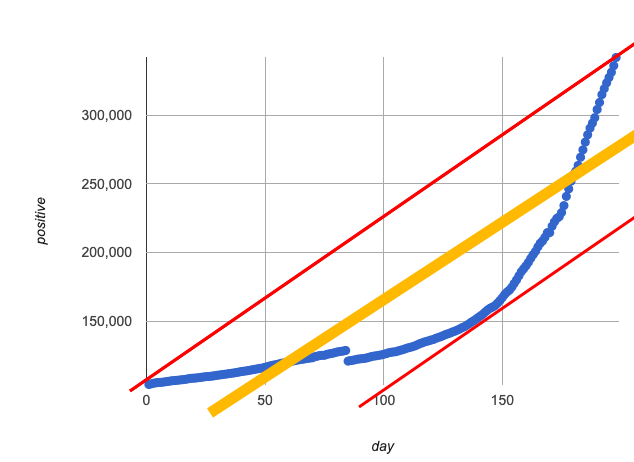
 If we make the line go from the start to the peak of the curve (top line), almost all of the points bulge out below our line of best fit.
If we make the line hit the bottom of the curve, all the points fall above it (bottom line).
Splitting the difference (orange line) is better than both of those options, and we might even get a halfway decent S!
But ultimately, straight-line, linear models just don’t behave like this curve, and we’ll never get the best-possible fit with them.
The number of positive cases is growing too fast to be fit with a linear model that grows at a constant rate!
Synthesize
-
Would a linear model fit just the first few months of the data?
-
If we only knew about first few weeks, would it be ok to use a linear model? Why or why not?
🔗Fitting Quadratic Models
Overview
Students try to fit a quadratic model to this data. This section makes heavy use of interactive slider activities we’ve built in Desmos to support open-ended experimentation. The ultimate goal is that students discover the need for models beyond linear and quadratic functions.
Launch
Maybe linear isn’t the way to go, here!
Make sure you’ve:
-
Clicked on "pacing" and set your teacher dashboard of Modeling Covid Spread (Desmos) to the first slide so that students are looking at the "Quadratic Models" screen
-
Generated your own link in Desmos for sharing the file with your students
-
Open the Desmos link I shared with you to the Modeling Covid Spread file.
-
You should be on Slide 1 (Quadratic Models).
-
Using the file, complete Quadratic Models for Covid in Massachusetts
Have students share their resulting models. Which one fits best?
In quadratic models, one quantity varies based on the square of another. Unlike linear models that grow evenly, we expect the response variable to grow by different amounts over equal intervals in the explanatory variable.
-
Are quadratic models a good fit for this data?
-
Why or why not?
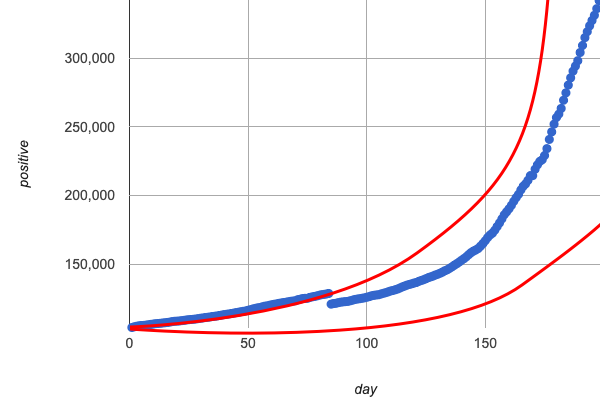
 Quadratic models change their rate of growth over time, which definitely makes them a better fit for this data than linear ones. It’s very likely we could find a quadratic model with a lower S-value than our linear model!
But this data starts out almost flat and then suddenly takes off like a rocket — quadratic models just don’t have that kind of explosive growth, so our model will never be as good as it could be.
Synthesize
-
This data grows very slowly in the beginning and then grows very quickly. Can you think of any other situations in real life that act like this?
-
Can you think of any graphs that might act like this?
These materials were developed partly through support of the National Science Foundation, (awards 1042210, 1535276, 1648684, 1738598, 2031479, and 1501927).  Bootstrap by the Bootstrap Community is licensed under a Creative Commons 4.0 Unported License. This license does not grant permission to run training or professional development. Offering training or professional development with materials substantially derived from Bootstrap must be approved in writing by a Bootstrap Director. Permissions beyond the scope of this license, such as to run training, may be available by contacting contact@BootstrapWorld.org.
