Students learn to transform the explanatory data (by building a new column that finds its log), use the new column to perform linear regression and produce the optimal linear model, then use the optimal linear model to generate the optimal logarithmic model for the original (untransformed) data.
Lesson Goals |
Students will be able to…
|
Student-facing Lesson Goals |
|
Materials |
|
Supplemental Materials |
|
Relevant Resources |
|
Preparation |
|
Key Points For The Facilitator |
|
🔗From Exponents to Logarithms
Overview
Students are asked to consider the graphs of logarithmic functions as the reflection of an exponential function across the diagonal line y = x.
Launch
Heads up: This launch refers back to data from Exploring the Spread of Disease.
The linear, quadratic and exponential models we’ve found for the Countries of the World Starter File all made predictions with too much error to be useful. But what other kinds of models are there?
-
Complete Swapping the Axes: Notice and Wonder.
-
What do you Notice? What do you Wonder?
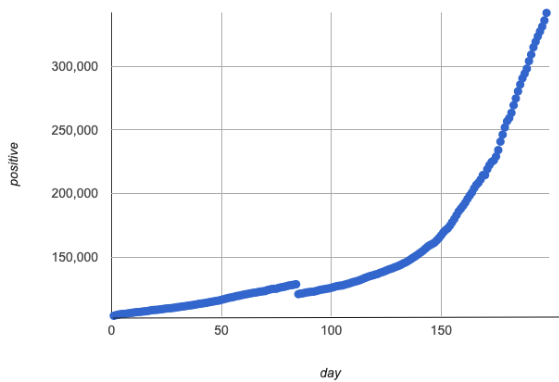
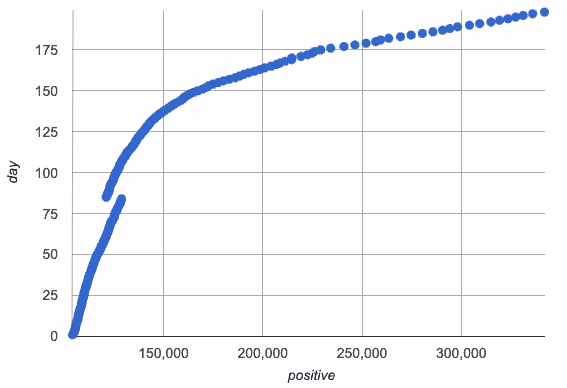
The kind of growth we’re seeing in the Countries dataset looks a lot like the Covid graph with the axes swapped!
When we reflect the covid curve over y = x, the graph starts with rapid growth, and then flattens out.
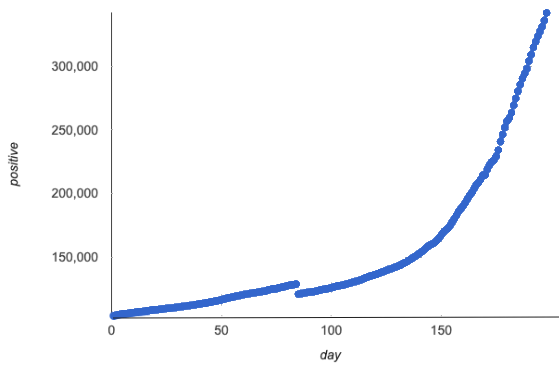
When we swap the axes, the model answers the opposite question!
| How many positive cases do we predict after x days? | How many days do we predict until we pass y cases? | |
|---|---|---|
|
|
We see that:
-
We had ~104,000 cases in our initial value ("day 0").
-
To reach 116,000 cases, it took 50 days.
-
To reach 126,000 cases, it took 100 days.
-
To reach 167,000 cases, it took 150 days.
-
To reach 350,000 cases, it took 200 days.
And we are much better able to understand just how quickly the infections were spreading.
When an exponential relationship is "inverted" like this, the new shape is called a logarithmic relationship.
Logarithmic functions and exponential functions serve as inverses of one another.
-
The Domain and Range are swapped.
-
The axes are swapped.
-
The curve is reflected over the diagonal line y = x.
"An exponential relationship looks logarithmic…if your x's and y's trade places!"
Asymptotes for Logarithmic Functions
You may remember that exponential functions have asymptotes: lines that the functions approach but never cross.
-
Is the asymptote of an exponential function horizontal or vertical?
-
Horizontal, defined as y = k
-
As y approaches the asymptote, it grows or shrinks by exponentially smaller amounts that approach zero
-
Given that logarithmic functions are the inverse of exponentials (reflected across y = x) what kind of asymptote do you think logarithmic functions have?
-
Vertical
Investigate
-
Turn to What Kind of Model? (Graphs & Scatter Plots) and identify the form of each curve.
-
For each display you identify as exponential or logarithmic, draw the diagonal line y = x and sketch the reflection of the curve.
Review student answers. Try to draw out student explanations for how they could tell whether a graph or plot was logarithmic instead of exponential. Their own reasoning is critical for building intuition, so you may even want to write down key phrases as students share them!
Which of the functions graphed below is a logarithm, and how can you tell?
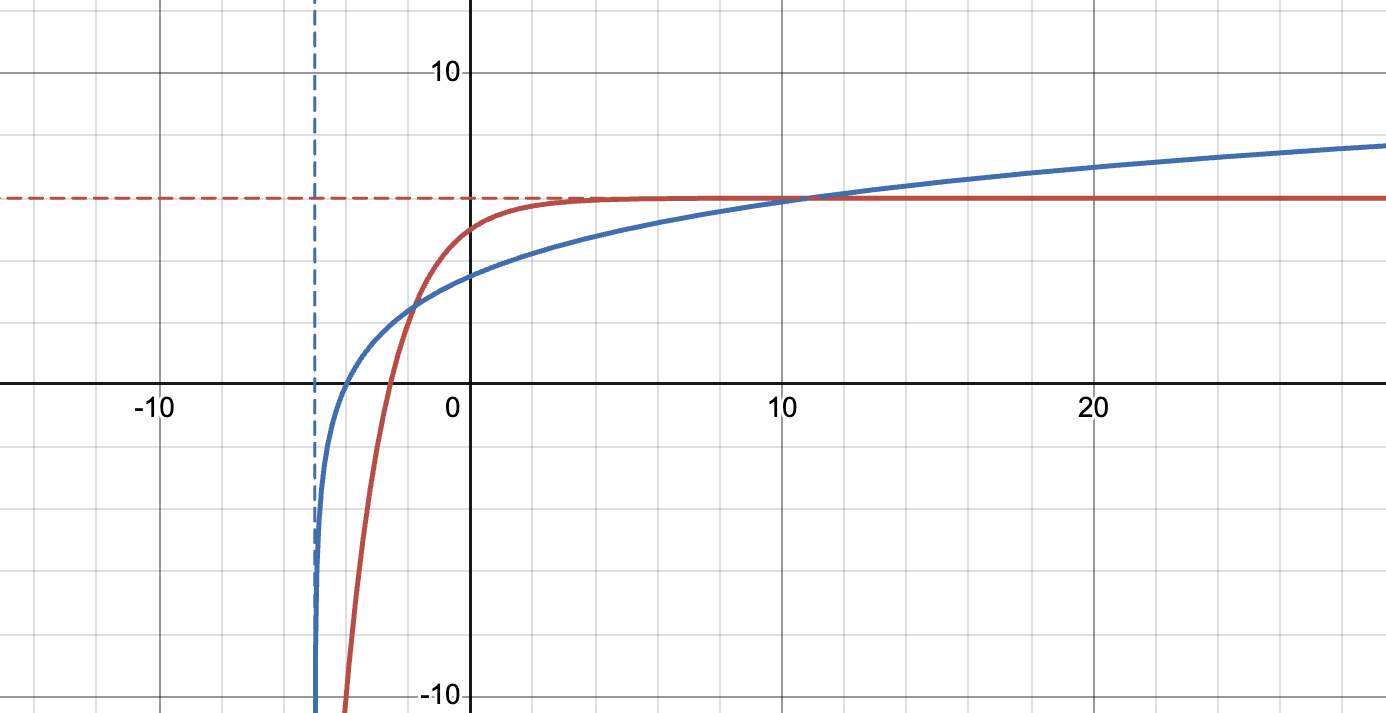
Come up with an explanation, and be prepared to share back!
Exponentials have horizontal asymptotes, whereas logarithms have vertical ones!
Computations with Exponents and Logarithms
We can use the inverse relationship between logarithms and exponents to do calculations.
Just as there are fact families for multiplication and division (e.g. 2 × 3 = 6 3 × 2 = 6 6 ÷ 2 = 3 6 ÷ 3 = 2), there are fact families for logarithms and exponents.
The two equations below are different ways of expressing the same relationship between the numbers 3, 5 and 125.
| Exponential Equation | Logarithmic Equation |
|---|---|
53 = 125 |
log5 125 = 3 |
5 is our base in both the exponential and logarithmic equations above.
Turn to From Exponents to Logs and complete the table in the first section by writing the related exponential or logarithmic equation for each row.
-
What logarithmic equation can we write from xy = z?
-
logx z = y
-
What exponential equation can we write from loga b = c?
-
ac = b
When we want to evaluate log expressions, it is helpful to think about these fact families.
| Expression | What you need to do | Evaluates to | |
|---|---|---|---|
Exponential |
32 |
"Calculate 3 to the power of 2" |
9 |
Logarithmic |
log3(9) |
"Calculate what power 3 is raised to in order to reach 9" |
2 |
-
What question do we ask ourselves to evaluate log3(81)?
-
To what power do we raise 3 to reach 81?
-
To get 81, what power do we raise 3 to?
-
What will log3(81) evaluate to?
-
4, because 34 = 81
-
Complete the rest of From Exponents to Logs to get some practice translating and evaluating log expressions.
-
Be sure to discuss your answers with at least one other student!
-
Consider these two translations of log2(128).
(a) "To get 128, I raise 2 to what power/exponent?"
(b) "The power/exponent to which you raise 2 to get 128"
-
Which translation do you prefer, and why?
-
The first one, because it sets up a math problem and makes it clear what I need to do.
-
The second one, because the numbers are in the same order that they appear in the expression (I can read left-to-right).
-
Is there another kind of translation that you like more?
-
Solicit and discuss student ideas!
-
What do you think of this question: "To get 5, I raise 1 what power/exponent?"
-
1 to any power will never be five!
Synthesize
-
How can we tell whether growth is exponential or logarithmic by looking at a graph?
-
Exponential growth is slow at first and gets faster.
-
Logarithmic growth is fast at first and gets slower.
-
What do we mean when we say that logarithmic functions and exponential functions serve as inverses of one another?
-
The axes are swapped.
-
The Domain and Range are swapped.
-
The models answer the opposite questions.
-
The curve is reflected over the diagonal line y = x.
🔗Logarithmic Sequences
Overview
Students learn to recognize logarithmic growth in tables.
Launch
We know that:
-
Linear sequences can be recognized by their consistent growth.
-
Exponential sequences can be recognized by identifying their growth factor.
But how would we recognize a logarithmic sequence?
Investigate
| Exponential Functions | Logarithmic Functions |
|---|---|
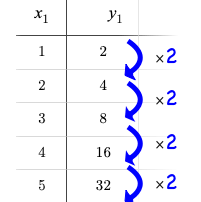
y grows exponentially over constant intervals of x |
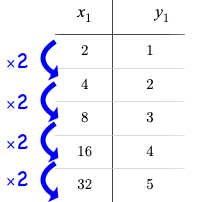
x grows exponentially over constant intervals of y |
y = 2x |
y = log2 x |
|
|
Just as swapping the Domain and Range makes a logarithmic curve look exponential, swapping the (x, y) columns of a table makes a logarithmic sequence look exponential.
-
Turn to What Kind of Model? (Tables) and decide whether you think each table is best modeled by a quadratic, exponential or logarithmic function.
-
If the table shows an exponential or logarithmic relationship, identify the base.
-
What strategies did you use to decide if a table represented a quadratic, exponential, or logarithmic function?
-
It is helpful for students to hear each other’s thinking in their own words!
-
Was it especially difficult (or simple) to recognize any of these function types? Why?
Logarithmic relationships help us survive!
 It’s very important for us to perceive a fire alarm as louder than a barking dog, but it’s not important to perceive how much louder one alarm is from another!
Our brains have evolved to be "optimized" for perceiving differences between "small" sights, sounds, smells, etc, but quickly lose the ability to distinguish between "big" ones.
This is known as the Weber–Fechner law states that the relationship between stimulus (real-world sensory input) and perception (how we perceive that input) is logarithmic!
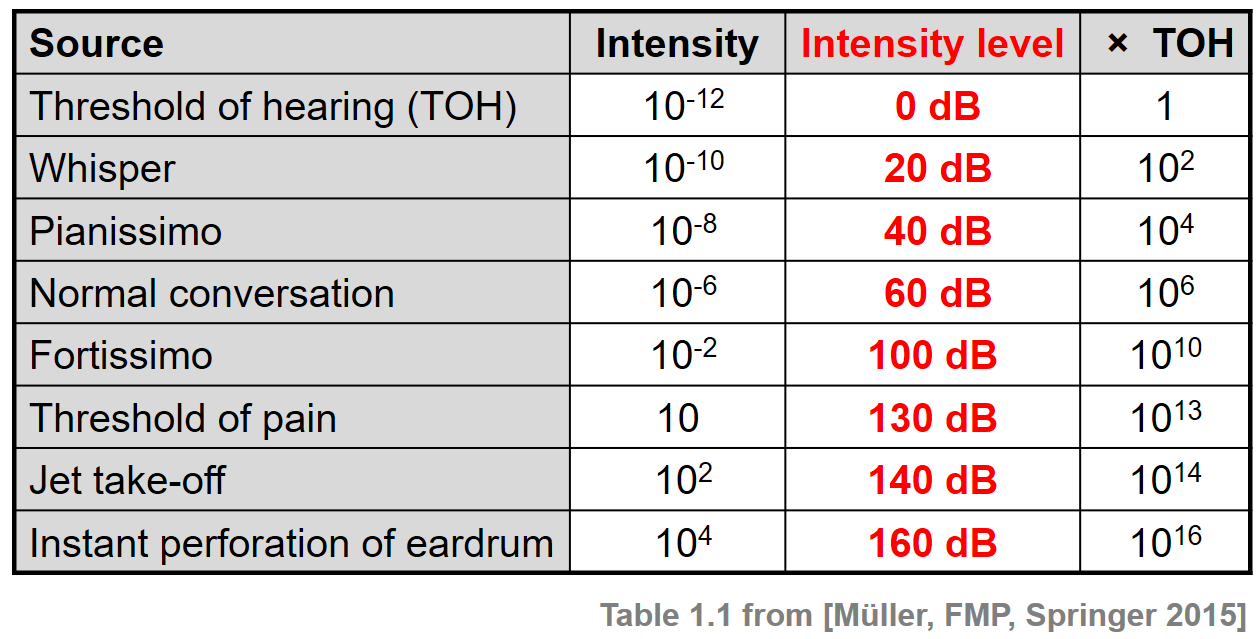
We don’t hear the world as it really is. We hear a logarithmically compressed version of it!
-
A fire alarm is thousands of times louder than a dog barking, but our brains don’t process that difference.
-
When we hear a sound that is ten times as loud as another, our brains perceive it to only be twice as loud.
-
Exponentially increasing sound-strength is perceived as constantly increasing loudness, so perception(sound−strength) is a logarithmic function.

We don’t taste spiciness as it really is. We taste a logarithmically compressed version of it!
-
The Scoville Scale measures how spicy we perceive a pepper to be, based on the amount of capsaicin in the pepper.
-
Each unit on the scale means there is an exponentially greater amount of capsaicin, so a pepper that measures a 4.0 actually contains ten times the capsaicin of a 3.0.
-
In other words, an exponentially-increasing amount of capsaicin is perceived as a constantly increasing spiciness, so spiciness(capsaicin) is a logarithmic function.
 We don’t see the world as it really is. We see a logarithmically compressed version of it!
-
A fraction of our field of view shows us just a few feet of an airplane wing, but that same fraction shows us hundreds of miles when looking at the ground far away.
-
Railroad tracks stretching off towards the horizon, they appear to grow closer and closer until it looks like those parallel lines might touch.
-
Exponentially increasing distance is perceived as constantly decreasing distance, so perception(distance) is a logarithmic function.
Students can check out this wonderful drawing from XKCD, which uses a logarithmic scale to fit the entire known universe into the image. The constantly-increasing vertical distance in the picture represents an exponentially-increasing distance, which is why the Eiffel Tower and Great Pyramid at the bottom appear "stretched out" at the bottom and "compressed" at the top!
Synthesize
-
What do logarithmic relationships allow us to do that other functions we’ve encountered don’t help us do well?
-
Compare things of very different sizes!
-
How are logarithmic functions and exponentials functions similar and different?
-
What have you learned about logarithmic functions that surprises you, excites you or makes you curious?
-
Can you think of other relationships that might best be modeled using logarithms?
🔗Logarithmic Functions
Overview
Students are introduced to the form of logarithmic models, and use a custom-built Desmos slider activity to explore how the model settings influence the shape of the model.
Launch
Most textbooks teach that logarithmic models have the form: f(x) = a logb(x) + k
That’s because most textbooks only present logarithmic functions with a horizontal shift of zero… and when h = 0, we can safely remove it and use the simplified form of the equation.
But, just as with other models we have explored, logarithmic models can have horizontal shift.
The expanded form for logarithmic models includes h and looks like this: f(x) = a logb(x−h) + k
Advance your teacher dashboard of Fitting Wealth-v-Health and Exploring Logarithmic Models (Desmos) to Slide 3: How does h transform logarithmic functions? and give your students time to reinforce their understanding of h−values from other models by connecting it to logarithmic functions.
Investigate
Sync or pace students to Slide 4: Exploring Logarithmic Functions of Fitting Wealth-v-Health and Exploring Logarithmic Models (Desmos). The following activity can be done two ways:
(1) Debrief with your students after they complete each section of Graphing Logarithmic Models: f(x) = a logb x + k.
(2) Wait until they have completed the entire page.
-
Let’s return to the Desmos file and explore how the constants in a logarithmic function definition impact the shape of its graph.
-
You should now be on Slide 4: Exploring Logarithmic Functions.
-
Use it to complete Graphing Logarithmic Models: f(x) = a logb x + k.
Review students answers, and then debrief via class discussion. Invite students to consider what new information they have gained by looking at graphical representations rather than tables.
Base b
The base of the logarithm is similar to the base (or growth factor) in an exponential expression…it just answers the opposite question!
The expression log2 1 is asking "to what power/exponent must 2 be raised to reach 1?
-
What power/exponent of 2 will evaluate to 1?
-
Zero
-
What question is log5 1 asking?
-
"To what power/exponent must 5 be raised, to reach 1?"
-
What power/exponent of 5 will evaluate to 1?
-
Zero
-
What can we conclude about logs that evaluate to 1?
-
They will always be zero, regardless of base!
Since any number to the zero power is 1… no matter the base, log(1) will always be zero!
-
Turn to What Kind of Model? (Descriptions) and practice identifying whether the scenarios are best modeled by linear quadratic, exponential, or logarithmic functions.
-
What clues did you use to help you identify which relationships were which?
Have students share their answers. Be especially attentive to students who mislabel logarithmic relationships as "exponential" — the relationship between the two is extremely subtle!
Most math books, Desmos, calculators, and programming languages offer a simple "log" function that doesn’t specify a base. By convention, if the base isn’t specified, it’s assumed to be base-10.
-
Pyret’s
logfunction uses base 10. -
Pyret’s
log-basefunction is for working with other bases. You’ll find it in the Contracts Pages.
Vertical Shift k
The term k is the vertical shift of the function, which moves the curve up or down.
-
Since loganything1 = 0, the value of a standard log model at x = 1 will always be 0 + k.
-
Note: We’ve seen vertical shifts in other kinds of functions given different names, like b for linear functions.
Logarithmic Coefficient a
The term a is called the logarithmic coefficient, which — along with the base (b) — affects the vertical stretch or compression of the logarithmic function and helps us determine how quickly the function grows.
| When comparing two logarithmic functions with the same base (b) | |
|---|---|
If ∣a∣ > 1 |
The graph of the function is vertically stretched, meaning it becomes steeper. |
If 0 < ∣a∣ < 1 |
The graph of the function is vertically compressed, meaning it becomes less steep. |
If a < 0 |
In addition to being stretched or compressed, the graph is reflected across the x-axis. |
In the data exploration students just completed, remind them that the asymptote is always located on the y-axis (x = 0).
Synthesize
-
What similarities do you see between exponential and logarithmic functions?
-
What differences do you see between exponential and logarithmic functions?
These materials were developed partly through support of the National Science Foundation, (awards 1042210, 1535276, 1648684, 1738598, 2031479, and 1501927).  Bootstrap by the Bootstrap Community is licensed under a Creative Commons 4.0 Unported License. This license does not grant permission to run training or professional development. Offering training or professional development with materials substantially derived from Bootstrap must be approved in writing by a Bootstrap Director. Permissions beyond the scope of this license, such as to run training, may be available by contacting contact@BootstrapWorld.org.

