Students investigate logarithmic relationships in data about countries of the world, using an inquiry-based model involving hypothesizing, experimental and computational modeling, and sense-making.
Lesson Goals |
Students will be able to…
|
Student-facing Lesson Goals |
|
Materials |
|
Supplemental Materials |
|
Preparation |
|
🔗Fitting by Transforming Data
Overview
Having discovered that changing the scale of a graph allows us to see logarithmic growth as linear, but still doesn’t allow us to treat it as linear, students learn to transform the data by applying a function to each row and building a new column that can be fit with a linear model.
Note: This also opens the door for teaching inverse functions!
Launch
We’ve seen that changing the scale on the x-axis from linear to logarithmic cancels out the logarithmic behavior by shrinking the x-axis to have intervals that grow exponentially and squishing the points so we perceive them as linear.
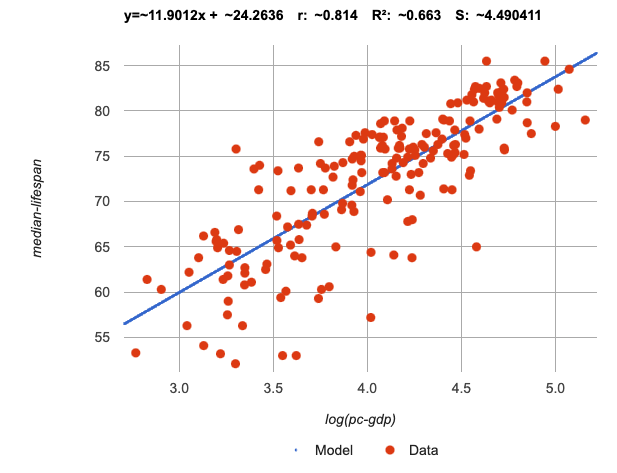
Instead of plotting pc-gdp on a logarithmic x-axis, we could transform the x-coordinates themselves and plot log(pc-gdp) on a linear x-axis. This would allow us to be able to use linear regression to obtain an optimal linear model!
Sync or pace students to Slide 8: Wealth-v-Health (Transformed) of Fitting Wealth-v-Health and Exploring Logarithmic Models (Desmos).
-
Let’s return to the Fitting Wealth-v-Health and Exploring Logarithmic Models Desmos file.
-
You should now be on Slide 8: "Wealth-v-Health (Transformed)".
-
Use it to complete Transforming the Data.
-
What values did you come up with for m and b in your best-guess linear model?
-
Record different students' responses for m and b on the board.
-
These numbers should be somewhat close to their earlier responses for a and k!
-
Were those values very similar to or very different from our best-guess logarithmic model?
-
How was transforming the data similar to changing the scale on the x-axis?
-
Transforming the data and changing the scale both made the logarithmic relationship look linear.
-
How was it different?
-
Changing the scale just made things look linear, but the data wasn’t any different.
The slope in the transformed, linear model is the same as the log coefficient in the untransformed logarithmic model.
The vertical shift in the transformed, linear model is the same as the vertical shift in the untransformed logarithmic model
Investigate
Now that we know how the model settings in our linear model of transformed data relate to the model settings in our logarithmic model, let’s return to Pyret to run linear regression on the transformed data, find the best possible linear model (the line of best fit), and use its model settings to define our optimal logarithmic model!
-
Open Countries of the World Starter File, and turn to Logarithmic Models.
-
Complete the first part ("Transforming: From Logarithmic Plots to Linear Ones"), then pause for class discussion.
We transformed the data in three steps:
-
Defined the transformation function g(r) to produce the log of the
pc-gdpcolumn. -
Built a new column
log(pc-gdp)by applying g(r) to transform each of our original x-values. -
Used the new column as the explanatory variable on the x-axis for our scatter plot.
Address any student questions about build-column, the Pyret function they’ve just discovered. Make sure that students have recorded the slope and vertical shift for their regression line. Then, emphasize the following key ideas.
-
At each point in our linear model, y is the predicted median lifespan, and x is the log of per-capita gdp in dollars.
-
We want x to represent the original, untransformed value, simply using per-capita gdp in thousands as-is…
-
Now let’s find our optimized logarithmic model.
-
Complete the second part ("Inverting: From Linear Models to Logarithmic Ones") of Logarithmic Models.
 Just like in Desmos, transforming the
 pc-gdp column with a log function produces a scatter plot showing a linear pattern in the data!
Pyret’s lr-plot tool computes the best possible linear model for our transformed data:
y = 11.9012x + ~24.2636
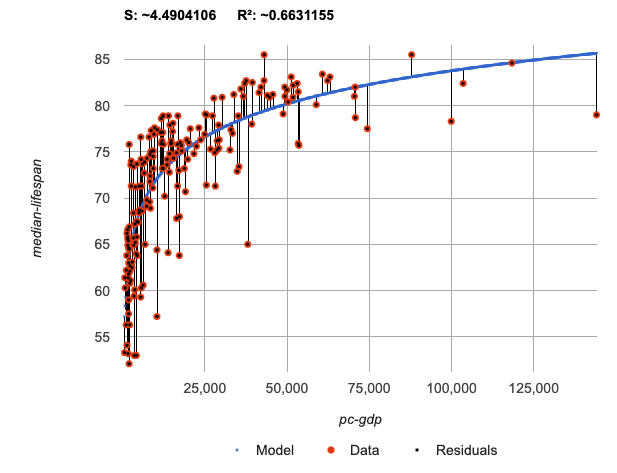
Our S has dropped to 4.49, showing a much better correlation than before.
 From Transforming the Data, we know that the model settings used in the transformed, linear model are the same ones used in the logarithmic, untransformed model:
linear(x) = 11.9012x + ~24.2636 logarithmic3(x) = 11.9012 log10(x) + 24.2636
The resulting logarithmic model can be fit to our original scatter plot, showing a much better fit than our 2-point-derived estimates.
-
How do you interpret this model?
Synthesize
-
Why is the S-value for our logarithmic model the same as the S-value for our linear model after transforming?
-
Why were our model settings for linear and logarithmic models the same, even though they were for different terms?
-
Why do you think the relationship between wealth and median lifespan is logarithmic?
-
Suppose all the tech companies in the Bay Area (Google, Apple, Facebook, etc.) decided to secede and form their own country with a
pc-gdpfar, far beyond the range of the rest of the data. Would it be appropriate to use our model to predict themedian-lifespanfor their employees? Why or why not?
-
Is it possible for someone to live to their 6000th birthday?
-
According to our model, is there a
pc-gdpthat would allow someone to live to 6000 years old? -
YES! It’s logarithmic so we’re talking an unimaginable
pc-gdp, but a logarithm will keep rising forever. -
If so, should we throw away the model?
-
NO! When building a model from data, a Data Scientist’s job is to find the model that best fits the data. In this case, the best-fit model happens to be logarithmic — even if it’s biologically impossible!
🔗Additional Exercises
For more practice transforming data and programming with filters:
Does Wealth impact lifespan equally if there’s Universal Healthcare? is a guided activity that repeats the Data Science and Linearization techniques used here, but with the idea of exploring the relationship of universal healthcare with respect to wealth and median lifespan.
We are working on collecting more datasets that can be modeled with logarithmic functions so that we can offer students more practice with using linear regression to build logarithmic models.
Optional Activity: Guess the Model!
-
Divide students into small groups (2-4), and have each team come up with a logarithmic, real-world scenario, then have them write down a logarithmic function that fits this scenario on a sticky note. Make sure no one else can see the function!
-
On the board or some flip-chart paper, have each team draw a scatter plot for which their logarithmic function is best fit. They should only draw the point cloud — not the function itself! Finally, students title their scatter plot to describe their real-world scenario (e.g. "Age of a Person from Birth to 16 vs. Number of Cells in their Body").
-
Have teams rotate, so that each team is in front of another team’s scatter plot. Have them figure out the original function, write their best guess on a sticky note, and stick it next to the plot.
-
Have teams return to their original scatter plot, and look at the model their colleagues guessed. How close were they? What strategies did the class use to figure out the model?
-
The model settings can be constrained to make the activity easier or harder. For example, limiting these model settings to whole numbers, positive numbers, etc.
-
To extend the activity, have the teams continue rotating so that each group adds their sticky note for the best-guess model. Then do a gallery walk so that students can reflect: were the models all pretty close? All over the place? Were the guesses for one model setting grouped more tightly than the guesses for another?
-
These materials were developed partly through support of the National Science Foundation, (awards 1042210, 1535276, 1648684, 1738598, 2031479, and 1501927).  Bootstrap by the Bootstrap Community is licensed under a Creative Commons 4.0 Unported License. This license does not grant permission to run training or professional development. Offering training or professional development with materials substantially derived from Bootstrap must be approved in writing by a Bootstrap Director. Permissions beyond the scope of this license, such as to run training, may be available by contacting contact@BootstrapWorld.org.
