Students are introduced to periodic functions through a dataset with perfect sinusoidal behavior: height on a revolving Ferris wheel. They see the same behavior reflected in the (x,y) coordinates of a point on a unit circle, and plot the graphs of the sine and cosine functions. Finally, they make the leap from degrees to radians.
Lesson Goals |
Students will be able to…
|
Student-facing Lesson Goals |
|
Materials |
|
🔗Looking for Patterns
Overview
Students are introduced to the notion of periodic relationships: related variables where the response variable repeats the same pattern over and over as the explanatory variable increases.
Launch
 A physics teacher comes back from a trip to the state fair, and keeps raving about some amazing ride they took. The class keeps asking them for details: was it a Roller coaster? Bumper cars? Merry-Go-Round?
Being a teacher, of course they decide to turn the class’s polite curiosity into a learning experience, and share some data they recorded from their smart watch. How can we figure out what ride they went on?
Investigate
Working in pairs or groups, complete Exploring Periodic Data.
time (minutes) |
altitude (feet) |
|---|---|
0 |
5.0 |
5 |
55.0 |
10 |
154.9 |
15 |
205.0 |
20 |
155.2 |
25 |
55.2 |
30 |
5.0 |
35 |
54.7 |
40 |
154.6 |
45 |
205.0 |
50 |
155.5 |
55 |
55.5 |
60 |
5.0 |
-
What are some of your Noticings, and what did they make you Wonder?
-
(Solicit a range of student responses)
-
What kind of ride do you think this teacher was on, and why?
-
Answers will vary. Write them all down on the board!
-
What about this data supports your theory?
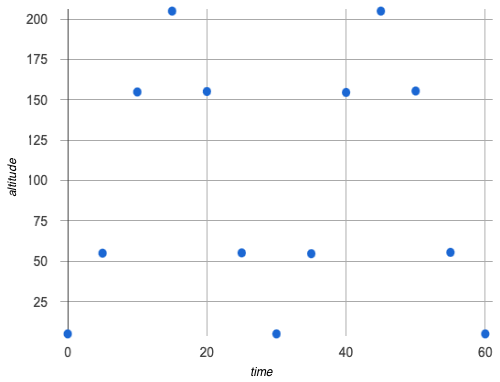
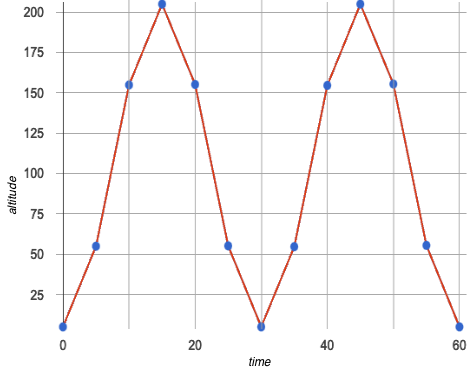
The teacher was probably on a Ferris wheel! We can tell because the ride keeps going up and down over and over, and it repeats this cycle over regular periods of about 30 minutes.
You just created a new type of data visualization, called a line graph. They are useful in situations where the explanatory variable is continuous, meaning that you know there are values in between the points.
It’s not appropriate to connect the dots on every scatter plot!
How do we know whether or not our explanatory variable is continuous here?
|
|
While we might only have recorded Ferris wheel data every 5 minutes, we know that:
-
The Ferris wheel keeps turning and generating data for an infinite number of points "in between" the times represented in our scatter plot.
-
The Ferris wheel existed at every one of those points, meaning there was
altitudedata to be gathered at all times.
Connecting the dots with the line gives us an approximation of what data is missing between those times, and helps us see the shape of the relationship.
Line graphs are often used instead of scatter plots when the explanatory variable is time.
-
Why was it helpful to connect the dots to form a line graph?
-
It was difficult to see the pattern until we added the line!
-
Do
timeandaltitudeappear to be related? -
(Solicit a range of student responses, guiding the class to there being a relationship)
-
What kind of relationship is it? Is it Linear? Quadratic? Something else?
-
(Let students discuss)
-
Why might we not want to use straight lines to connect these dots?
-
We don’t know for sure what the data looks like between those points, and we certainly don’t know if it’s linear!
Synthesize
-
When does it make sense to connect the dots on a scatter plot?
-
When the explanatory variable is continuous, like time.
🔗Unit Clocks
Overview
Students begin to reason about points on the circumference of a circle, with their x- and y-coordinates varying as a function of rotation.
Launch
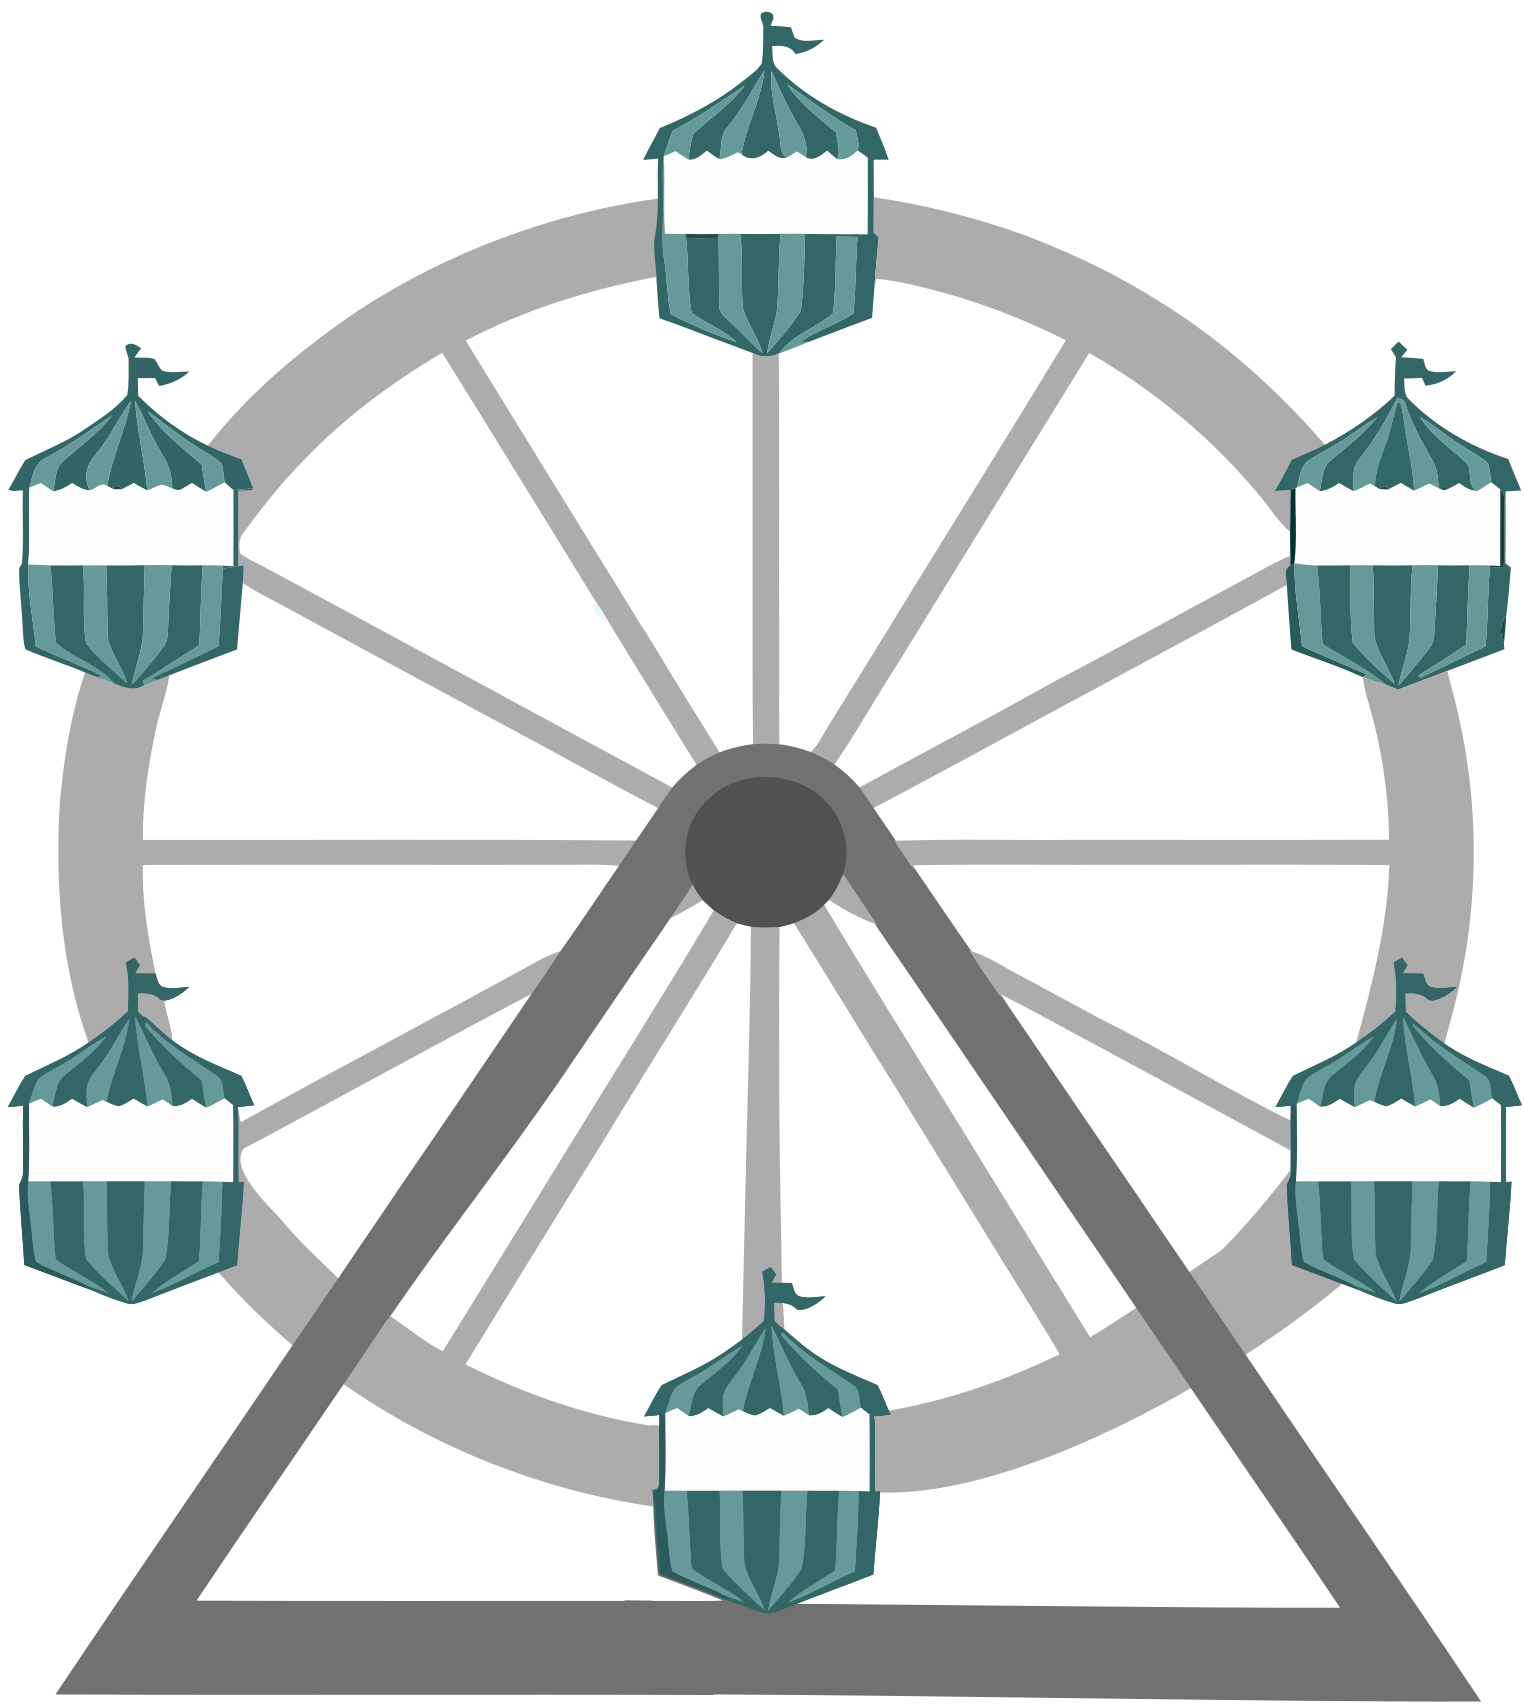 The teacher’s seat on the Ferris wheel can be thought of as a point on the circumference of a rotating circle.
-
The y-coordinate (
altitude) goes from 5ft to 205ft then back down to 5, then up again, then down again… -
This pattern of y-coordinates is periodic, repeating at regular intervals (over a period of 30 minutes)
None of the models we’ve seen so far will help us predict how far off the ground (y-coordinate) the seat is after a length of time (x-coordinate). Some of them increase or decrease forever (linear, exponential, logarithmic), and others change directions once (quadratic), but not over and over in a cycle!
Modeling cyclical relationships is incredibly important, for everyone from farmers to fishermen to healthcare providers!
So many things in nature come in cycles:
-
The sun rises and sets every day: sun−height(time) is periodic
-
The tides come in and out each day: tide(time) is periodic
-
People tend to get sick in the winter: flu−cases(date) is periodic
We’re going to explore a new class of functions — periodic functions — that we can use to model cyclical relationships like these.
Why not "Trigonometric"?
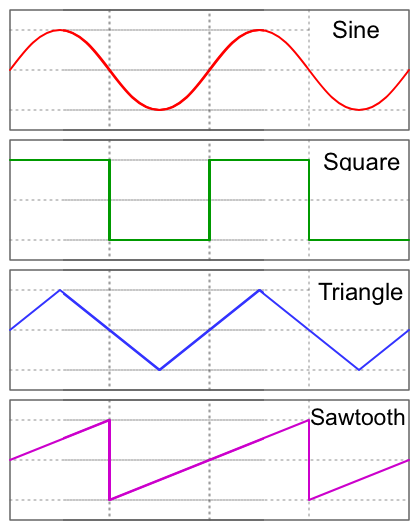 "Periodic" is a broader term than trigonometric (or sinusoidal). Science and engineering teachers will be quick to point out that periodic functions can be used to model both relationships that cycle (smooth ups-and-downs) and those that oscillate (any kind of up-and-down!)
We’ve chosen to use periodic functions, because the term applies in all of these classes. As always, we advise you to use the term that works best for your classroom context!
Investigate
To wrap our heads around periodic functions, let’s think about something simpler than a Ferris wheel. Consider a simple clock that is centered around the origin, with a radius of 1.
Note that the "unit clock" we are referring to here is not the same thing as the unit circle commonly referenced in math textbooks. We are consciously making the choice to use the clock instead because it is far more familiar and less abstract for students. We encourage you to resist the temptation to jump to discussing unit circles at this time. We will discuss similarities and differences of clocks and unit circles later in the lesson.
Heads up: You may need to remind your brain that, unlike unit circles, clock hands move clockwise!
-
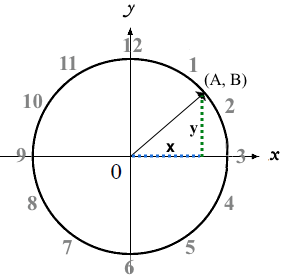 The "hand" of the clock is just a radius, which hits the circumference at a point we’ll call (A, B).
 -
As time passes, the hand spins around the circle, taking (A, B) with it.
-
At 12 o’clock, the radius lands at (A = 0, B = 1).
-
At 3 o’clock, the radius lands at (A = 1, B = 0).
-
At 6 o’clock, the radius lands at (A = 0, B = −1).
-
-
That radius also forms the hypotenuse of a right triangle with sides x and y, shown here in green and blue.
-
As the point (A, B) moves around the circle, the values of A and B rise and fall between 1 and -1, over and over.
-
With a partner, complete the first section ("A and B, around the clock ") of Reasoning about Unit Clocks.
A and B both vary as a function of $$\displaystyle \textit{time}$$, giving us functions $$\displaystyle A(\textit{time})$$ and $$\displaystyle B(\textit{time})$$.
-
At what time(s) does the radius land on the point (0,-1)?
-
6 o’clock
-
At what time(s) does $$\displaystyle B(\textit{time})=0$$ so that the radius sits along the x-axis?
-
3:00 lands on (1,0)
-
9:00 lands on (-1,0)
-
At which time(s) does $$\displaystyle A(\textit{time})=B(\textit{time})$$, where the legs x and y are equal?
-
1:30 and 7:30
-
When $$\displaystyle A(\textit{time}) = B(\textit{time})$$, how could we calculate the length of A and B from this right triangle?
-
We could use the Pythagorean Theorem, with A = B: A2 + A2 = 12
-
With a partner, complete the second section of Reasoning about Unit Clocks.
-
Then open Unit Clock Starter File to complete the page.
 As the point (A, B) travels around the circumference of a circle, it reflects a changing angle θ. Think of a pizza slice, with θ as the angle at the tip of the slice, and the crust as the amount of the circumference the point has traveled.
In our clock example, we divide the circle into twelve "slices", each representing one hour.
-
How many of those slices would represent 2 hours?
-
2 slices
-
How many of those slices would represent 3 hours?
-
3 slices
-
How many of those slices would represent a half hour (i.e. 30 minutes)?
-
1/2 of a slice
-
How many of those slices would represent 15 minutes?
-
1/4 of a slice
-
Of course, there are other ways besides 12 slices of "hours" to measure angles! Can you think of another measure that divides a circle up differently?
-
Degrees, divide a circle up into 360 slices instead of 12.
-
How many minutes are represented by 1 degree?
-
2
-
-
How many minutes are represented by 2.5 degrees?
-
5
-
-
-
Minutes, which divide our 12-hours into 720 slices. We could imagine one-and-a-half of these slices representing 90 seconds, or 2 slices for 120 seconds.
-
Compass Directions like North, South, East, and West, which divide our circle up into 4 slices instead of 12.
-
How many slices represent the angle between North and South?
-
2
-
-
How many slices represent the angle between West and Southwest?
-
half a slice
-
-
We can divide a circle any way we want!
In our clock animation we have 12 "slices", with 12 evenly-spaced labels around the clock.
-
Return to the Unit Clock Starter File, change
num-slicesto 360, and click "Run". What changed? What stayed the same? -
Take a minute to play with
num-slicesandnum-labels, making sure thatnum-labelsdivides evenly intonum-sliceswith no remainder! -
Can you divide the clock into 70 slices? 92?
Synthesize
-
Does changing the number of slices effect the way the curves are drawn? Why or why not?
-
Let students discuss.
-
The height of the curves depends only on the radius of the circle. Changing the number of circle-slices or names of the labels doesn’t change the radius, nor will it change the curves.
🔗From Hours to Radians
Overview
Students are introduced to radians, and practice converting between different units of angle measurement.
Launch
Conveniently, we can chop up circles based on whatever kind of math we want to do, and the devices we have available to do our computations with.
-
The Babylonians chose to use 360 slices to map out the "circle" representing the night sky, because 360 is roughly the number of days in a year and most easy-to-see constellations repeat their cycles annually.
-
360 is also easily divided by common numbers like 2, 3, 4, 6, 8, 9, 10, and 12, which makes calculating with those numbers a lot easier.
-
They also noticed that there were roughly 12 full moons each year and that 12 is a convenient number for calculations done people who only have their hands to count with, because a hand has 12 finger joints that can be touched with the thumb.
-
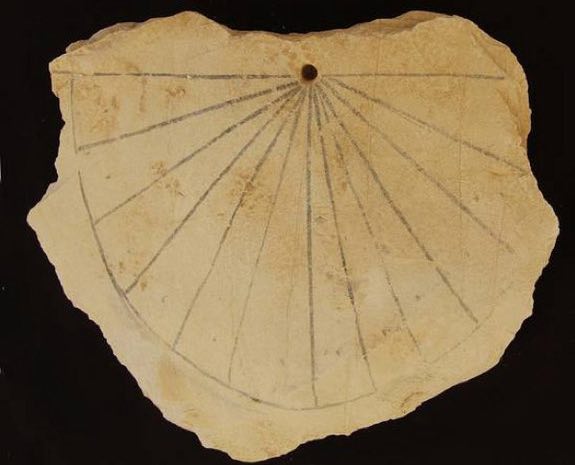 The oldest-known sundialMany ancient peoples divided the night and day into 12 slices each (giving us 24 hours). The division of the sky into twelve slices influenced everything from astrological charts (12 zodiac signs), to time-keeping.
 -
Starting with the oldest-known sundial (from 1500 B.C.!), sundials map the journey of the shadow cast by the sun as it moves across the sky, dividing the map into 12 slices.
-
The idea of time-keeping in groups of twelve became the 12 hours on the modern-day clocks we all use, and the motion of the clock hand around a circle is designed to mimic the rotation of the shadow on a sundial!
We often want to talk about the distance traveled around the circumference of a circle.
-
For example, if we’re building an arch out of bricks, we want to know how many bricks to use.
-
We might also want to know how far our teacher traveled on their trip around the Ferris wheel.
Calculations involving circumference all involve the radius of the circle. Is there a way to divide the circle into slices so that radial calculations are easy? It would be nice to have a measurement of angle that’s expressed in terms of a radius, to make the math cleaner…
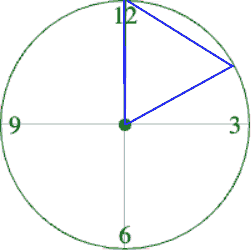
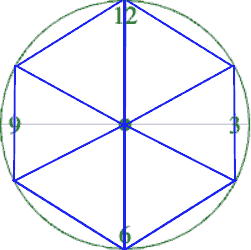 Suppose the hand of our clock was made of rubber, and we could take it off and bend it around the circle. How many "clock hands" would it take to wrap all the way around the clock?
-
We can start by imagining each slice as an equilateral triangle, where all three sides are exactly one radius.
-
This would give us exactly six slices, with the tip of each slice having a 60° angle…
-
We could go all the way around the clock circle with 6 of those triangles. Would 6 radii be enough distance to get around the circumference of the circle?
-
No — they make a hexagon whose perimeter is almost as big as the circle, but not quite!
In order to bend the outer edge of the triangle into a curve that lands on the edge of the circle, while keeping the length of the curve equal to the radius, we’d have to make the angle just slightly less than 60°.
Radian: the measure of the angle formed by carving out a radius’s worth of the circumference
If θ of each "radian" slice is slightly less than 60°, we can fit slightly more than 6 of these slices in our pie. In fact, we can fit exactly 6.28 (2pi) of these "radius slices"!
360° = 2π radians
-
Where else have you seen pi before?
-
In all of the geometric formulas for circles and other shapes with circular bases and/or cross sections.
-
If there are 2π radians in the whole circle, how many radians are in the semi-circle between 3pm and 9pm on our clock?
-
1π
-
How many radians are there in the quarter-circle between 12pm and 3pm?
-
$$\displaystyle \pi \over\displaystyle 2$$
-
How many radians are there in a single "hour" of the clock?
-
$$\displaystyle \pi \over\displaystyle 6$$
Investigate
Pyret knows about π, too!
-
In the Interactions Area, try evaluating
PI(all caps!). What do you get back? -
Try computing the value of 3π.
-
Try computing the value of π / 2.
Be prepared to remind students to read the error messages when they type 3PI instead of 3 * PI and PI/2 instead of PI / 2.
As with hours, degrees, and compass directions, switching our unit-clock graph from hours to radians doesn’t change the curve of our graph at all. It only changes the tick marks on the x-axis.
Note: The conventions for labeling a clock are different from the conventions for labeling circles with Radians or Degrees.
| hours on a clock | vs | radians and degrees on a unit circle |
|---|---|---|
start from the top |
start from zero on the right |
|
increase clockwise |
increase counter-clockwise |
These are conventions that people have agreed upon over time to make it easy to collaborate. It’s like driving on the right side of the road v. the left: it doesn’t matter what we choose, as long as everyone makes the same choice!
We could make a clock with the numbers written backwards and have the hands move the other way! And as long as everyone uses the same clock, we can still tell time.
Regardless of the direction the "hands" turn, or whether we’re dividing the circle into hours, minutes, radians, or anything else, the plotted curves will always be the same.
-
Complete the first question on Converting Between Angles
Mathematicians use special names for these functions. They call them sine and cosine, rather than "A" and "B"!
In Pyret (and on most calculators) these functions consume radians and their names are abbreviated as sin and cos.
The contracts for these functions are:
# sin :: Number -> Number
# cos :: Number -> Number
-
One of these two functions computes the "x values" from our unit circle (A on the unit clock).
-
The other function computes the y-values (B on the clock).
-
To figure out which function is which, use Pyret to complete Converting Between Angles.
-
Remember:
sinandcosconsume radians… not hours, minutes, pizza slices or degrees!
-
opposite side and the hypotenuse.">sine — the height of the right-triangle at a given angle ("time" in our example)
-
cosine — the width of the right-triangle at a given angle
Where did these Names Come From?
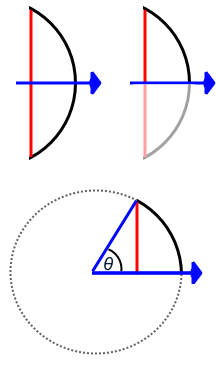 In ancient India, mathematicians thought that a vertical line drawn across the circle resembled the bowstring of a bow-and-arrow, which is also called a "cord". When cut in half, this "half-cord" represented the height of a right triangle formed by the angle! The Sanskrit word for "chord", "jiva", was transliterated by Arabic mathematicians into "jiba"1.
In the 12th century, Latin mathematicians mis-interpreted the Arabic jiba as jaib, a completely different word meaning "pocket". When translated, the Latin word for "pocket" is sinus. The remaining part of the 180° or π in the semicircle formed by the bow is the "completion of the pocket", and the Latin prefix "co-" was used to name the length drawn by the remaining angle cosinus.
[1] - Transliterating "v" and "b" sounds between languages is really common! Ask a Spanish-speaker how to pronounce the word "veinte" ("twenty")! They’ll say "BEN-tay".
When graphed, each of these functions shows us the relationship between the angle and the height (sine), or the angle and the width (cosine).
Synthesize
-
Which function computes the horizontal leg A?
-
cos -
Which function computes the vertical leg B?
-
sin -
If
sinandcosconsumed and produced degrees instead of radians, would the shape of the curve change? Why or why not? -
No. This would be exactly the same as changing the slices and labels around the circle: same graph, same curves, different markings.
These materials were developed partly through support of the National Science Foundation, (awards 1042210, 1535276, 1648684, 1738598, 2031479, and 1501927).  Bootstrap by the Bootstrap Community is licensed under a Creative Commons 4.0 Unported License. This license does not grant permission to run training or professional development. Offering training or professional development with materials substantially derived from Bootstrap must be approved in writing by a Bootstrap Director. Permissions beyond the scope of this license, such as to run training, may be available by contacting contact@BootstrapWorld.org.

